Answered step by step
Verified Expert Solution
Question
1 Approved Answer
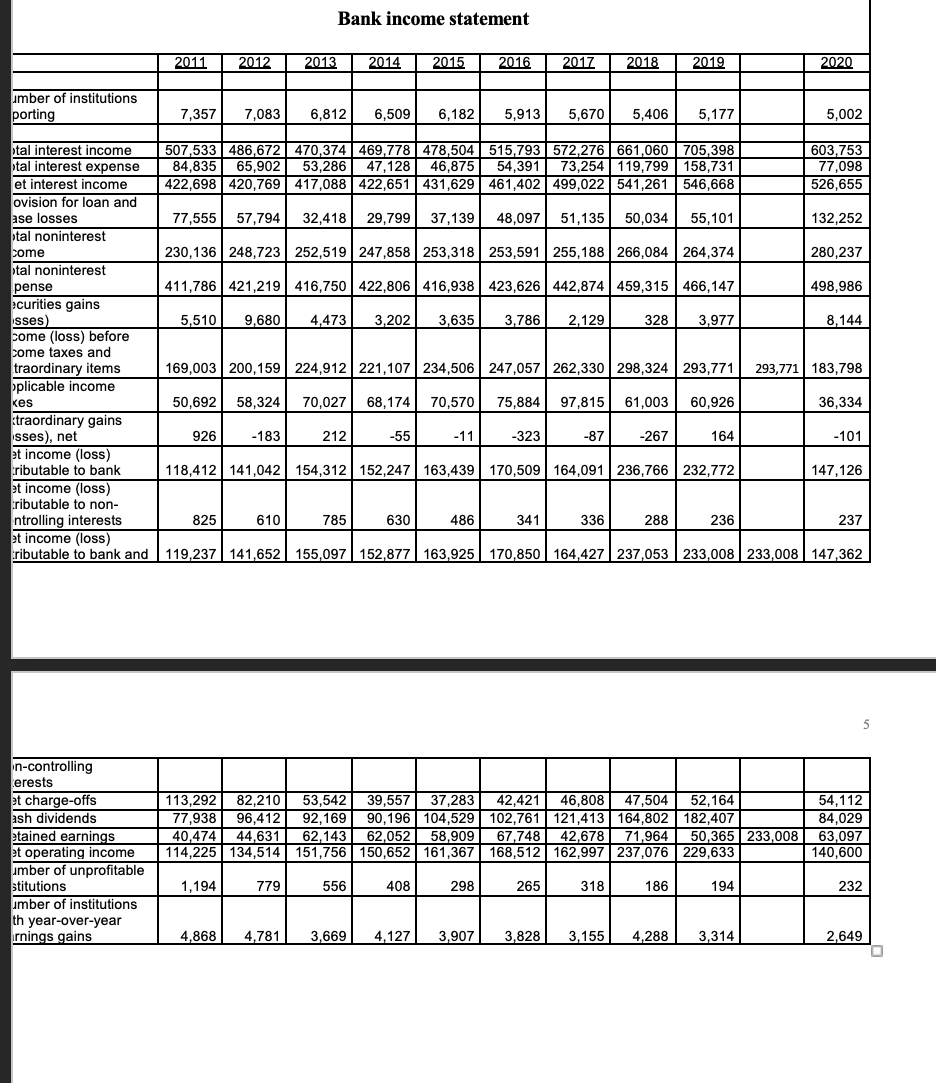
What is the net income? Bank income statement 2011 2012 2013 2014 2015 2016 2017 2018 2019 umber of institutions porting 7,357 7,083 6,812 6,509
What is the net income?

Bank income statement 2011 2012 2013 2014 2015 2016 2017 2018 2019 umber of institutions porting 7,357 7,083 6,812 6,509 6,182 5,913 5,670 5,406 5,177 5,002 603,753 tal interest income tal interest expense et interest income ovision for loan and ase losses 507,533 486,672 470,374 469,778 478,504 515,793 572,276 661,060 705,398 84,835 65,902 53,286 47,128 46,875 54,391 73,254 119,799 158,731 417,088 422,651 431,629 461,402 499,022 541,261 546,668 77,098 422,698 420,769 526,655 77,555 57,794 32,418 29,799 37,139 48,097 51,135 50,034 132,252 tal noninterest come 55,101 230,136 248,723 252,519 247,858 253,318 253,591 255,188 266,084 264,374 280,237 tal noninterest pense 411,786 421,219 416,750 422,806 416,938 423,626 442,874 459,315 466,147 498,986 ecurities gains sses) come (loss) before 5,510 9,680 4,473 3,202 3,635 3,786 2,129 328 3,977 8,144 come taxes and traordinary items 293,771 183,798 oplicable income 169,003 200,159 224,912 221,107 234,506 247,057 262,330 298,324 293,771 75,884 97,815 61,003 60,926 kes 36,334 traordinary gains sses), net 50,692 58,324 70,027 68,174 70,570 926 -183 212 -55 -11 -323 -87 118,412 141,042 154,312 152,247 163,439 170,509 164,091 236,766 232,772 -267 164 -101 147,126 et income (loss) tributable to bank et income (loss) ributable to non- ntrolling interests 825 610 785 630 et income (loss) tributable to bank and 119,237 141,652 155,097 152,877 163,925 170,850 164,427 237,053 233,008 233,008 147,362 486 341 336 288 236 237 5 n-controlling erests 52,164 182,407 et charge-offs ash dividends etained earnings et operating income umber of unprofitable stitutions 113,292 82,210 53,542 39,557 37,283 42,421 46.808 47,504 77,938 96.412 92,169 90,196 104,529 102,761 121,413 164,802 40.474 44.631 62,143 62,052 58,909 67,748 42,678 71,964 114,225 134,514 151,756 150,652 161,367 168,512 162,997 237,076 50,365 233,008 229,633 1,194 779 556 408 298 265 318 186 194 umber of institutions th year-over-year rnings gains 4,868 4,781 3,669 4,127 3,907 3,828 3,155 4,288 3,314 2020 54,112 84,029 63,097 140,600 232 2,649 0 Bank income statement 2011 2012 2013 2014 2015 2016 2017 2018 2019 umber of institutions porting 7,357 7,083 6,812 6,509 6,182 5,913 5,670 5,406 5,177 5,002 603,753 tal interest income tal interest expense et interest income ovision for loan and ase losses 507,533 486,672 470,374 469,778 478,504 515,793 572,276 661,060 705,398 84,835 65,902 53,286 47,128 46,875 54,391 73,254 119,799 158,731 417,088 422,651 431,629 461,402 499,022 541,261 546,668 77,098 422,698 420,769 526,655 77,555 57,794 32,418 29,799 37,139 48,097 51,135 50,034 132,252 tal noninterest come 55,101 230,136 248,723 252,519 247,858 253,318 253,591 255,188 266,084 264,374 280,237 tal noninterest pense 411,786 421,219 416,750 422,806 416,938 423,626 442,874 459,315 466,147 498,986 ecurities gains sses) come (loss) before 5,510 9,680 4,473 3,202 3,635 3,786 2,129 328 3,977 8,144 come taxes and traordinary items 293,771 183,798 oplicable income 169,003 200,159 224,912 221,107 234,506 247,057 262,330 298,324 293,771 75,884 97,815 61,003 60,926 kes 36,334 traordinary gains sses), net 50,692 58,324 70,027 68,174 70,570 926 -183 212 -55 -11 -323 -87 118,412 141,042 154,312 152,247 163,439 170,509 164,091 236,766 232,772 -267 164 -101 147,126 et income (loss) tributable to bank et income (loss) ributable to non- ntrolling interests 825 610 785 630 et income (loss) tributable to bank and 119,237 141,652 155,097 152,877 163,925 170,850 164,427 237,053 233,008 233,008 147,362 486 341 336 288 236 237 5 n-controlling erests 52,164 182,407 et charge-offs ash dividends etained earnings et operating income umber of unprofitable stitutions 113,292 82,210 53,542 39,557 37,283 42,421 46.808 47,504 77,938 96.412 92,169 90,196 104,529 102,761 121,413 164,802 40.474 44.631 62,143 62,052 58,909 67,748 42,678 71,964 114,225 134,514 151,756 150,652 161,367 168,512 162,997 237,076 50,365 233,008 229,633 1,194 779 556 408 298 265 318 186 194 umber of institutions th year-over-year rnings gains 4,868 4,781 3,669 4,127 3,907 3,828 3,155 4,288 3,314 2020 54,112 84,029 63,097 140,600 232 2,649 0
Step by Step Solution
There are 3 Steps involved in it
Step: 1

Get Instant Access to Expert-Tailored Solutions
See step-by-step solutions with expert insights and AI powered tools for academic success
Step: 2

Step: 3

Ace Your Homework with AI
Get the answers you need in no time with our AI-driven, step-by-step assistance
Get Started


