

Answered step by step
Verified Expert Solution
Question
1 Approved Answer
What is the P value for the test 8.640 0.864 0.0000000864 44.739 3,490 Exam 4 - ANOVA and Regression Excel output (dragged).pdf (1 page) Exam
What is the P value for the test
8.640
0.864
0.0000000864
44.739
3,490
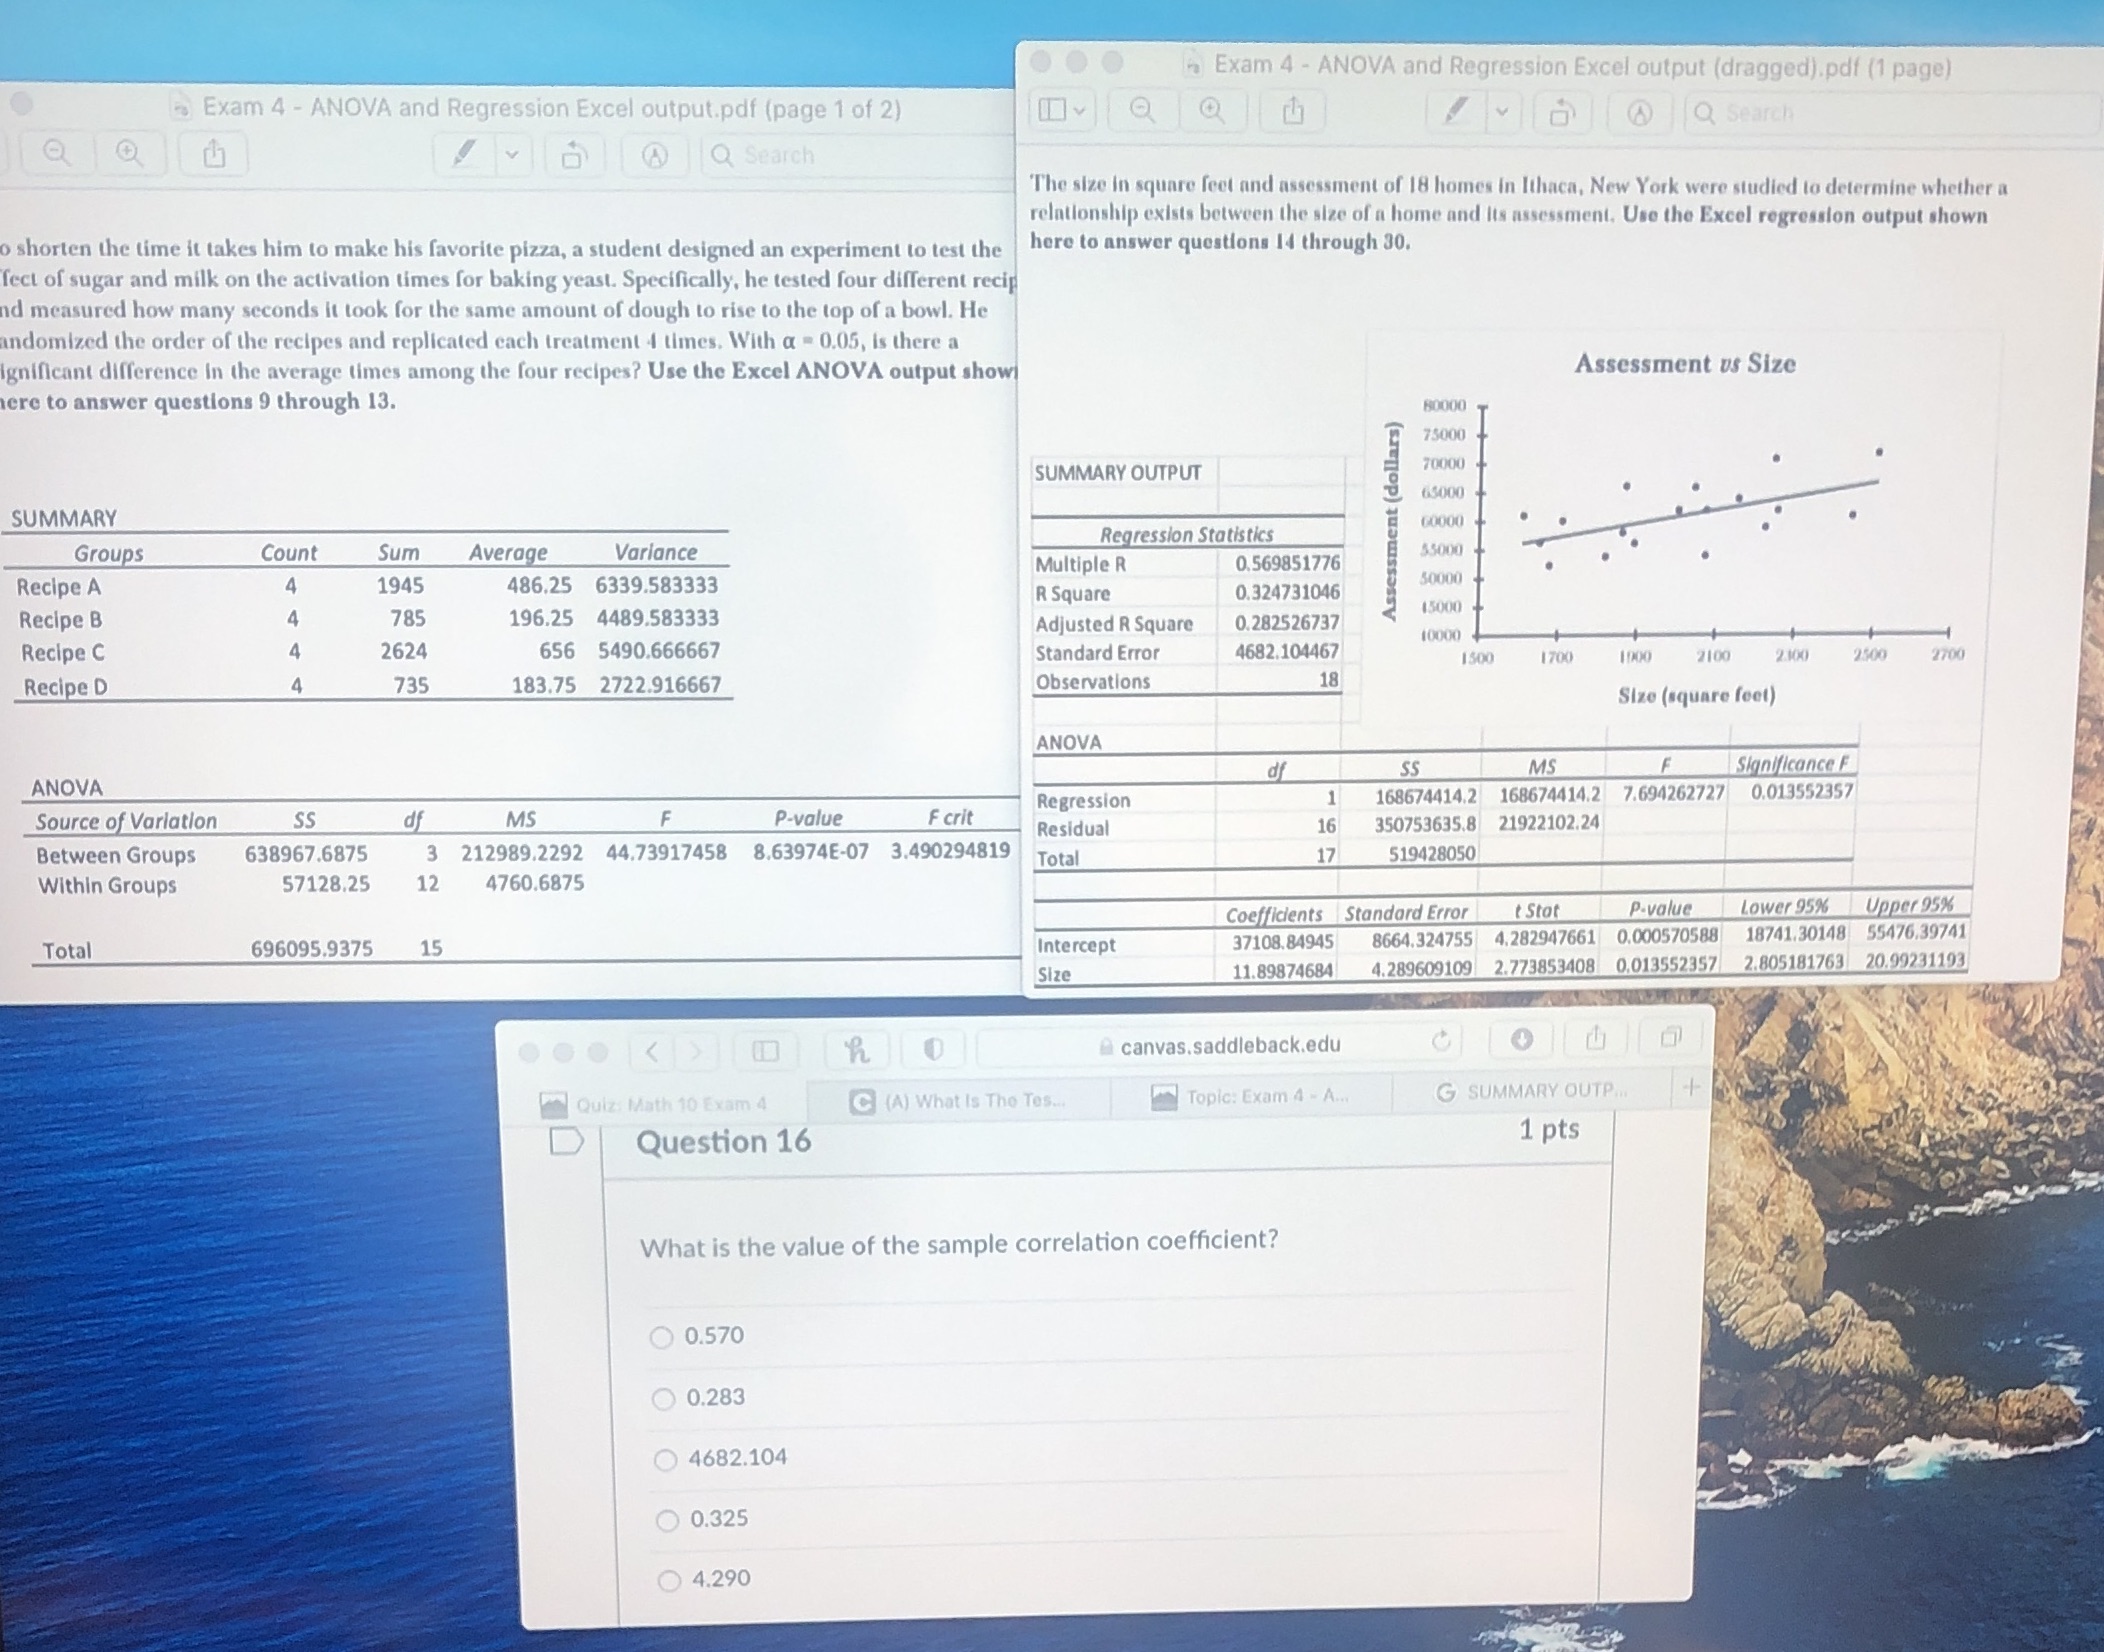 Exam 4 - ANOVA and Regression Excel output (dragged).pdf (1 page) Exam 4 - ANOVA and Regression Excel output.pdf (page 1 of 2) ! " & @ Q Search B @ Q Search The size in square feet and assessment of 18 homes in Ithaca, New York were studied to determine whether a relationship exists between the size of a home and its assessment. Use the Excel regression output shown shorten the time it takes him to make his favorite pizza, a student designed an experiment to test the here to answer questions 14 through 30. lect of sugar and milk on the activation times for baking yeast. Specifically, he tested four different recip nd measured how many seconds it took for the same amount of dough to rise to the top of a bowl. He andomized the order of the recipes and replicated each treatment 4 times. With a = 0.05, is there a ignificant difference in the average times among the four recipes? Use the Excel ANOVA output show Assessment us Size ere to answer questions 9 through 13. 80000 75000 SUMMARY OUTPUT 70000 ment (dollar 65000 SUMMARY GOOOO Groups Count Sum Average Variance Regression Statistics 35000 Multiple R 0.569851776 Recipe A 1945 486.25 6339.583333 50000 R Square 0.324731046 Recipe B Ass 785 196.25 4489.583333 45000 Adjusted R Square 0.282526737 Recipe C 2624 656 5490.666667 10000 Standard Error 4682.104467 1500 1700 1900 2100 2100 2500 2700 Recipe D 735 183.75 2722.916667 Observations 18 Size (square feet) ANOVA ANOVA df SS MS Significance F 168674414.2 168674414.2 7.694262727 0.013552357 Source of Variation SS P-value Regression of MS crit Residual 16 350753635.8 21922102.24 Between Groups 638967.6875 3 212989.2292 44.73917458 8.63974E-07 3.490294819 Total 17 519428050 Within Groups 57128.25 12 4760.6875 Coefficients Standard Error t Stat P-value Lower 95% Upper 95% Total 696095.9375 15 Intercept 37108.84945 8664.324755 4.282947661 0.000570588 18741.30148 55476,39741 Size 11.89874684 4.289609109 2.773853408 0.013552357 2.805181763 20.99231193 O . . I RO canvas.saddleback.edu Quiz: Math 10 Exam 4 C (A) What Is The Tes. Topic: Exam 4 - A. G SUMMARY OUTP.. D Question 16 1 pts What is the value of the sample correlation coefficient? 0.570 0.283 4682.104 0.325 4.290
 Step by Step Solution
There are 3 Steps involved in it
Step: 1

Get Instant Access to Expert-Tailored Solutions
See step-by-step solutions with expert insights and AI powered tools for academic success
Step: 2

Step: 3
Ace Your Homework with AI
Get the answers you need in no time with our AI-driven, step-by-step assistance
Get Started
A First Course In Differential Equations
Authors: Kumari Vandana
1st Edition
9353147123, 9789353147129