

Answered step by step
Verified Expert Solution
Question
1 Approved Answer
What is the present value of Broadway's cash flows post-acquisition? I Exhibit 1 Landmark Facility Solutions: Simplified Financial Statements, 2010-2014 ($ millions) Income Statement Net
What is the present value of Broadway's cash flows post-acquisition?
I
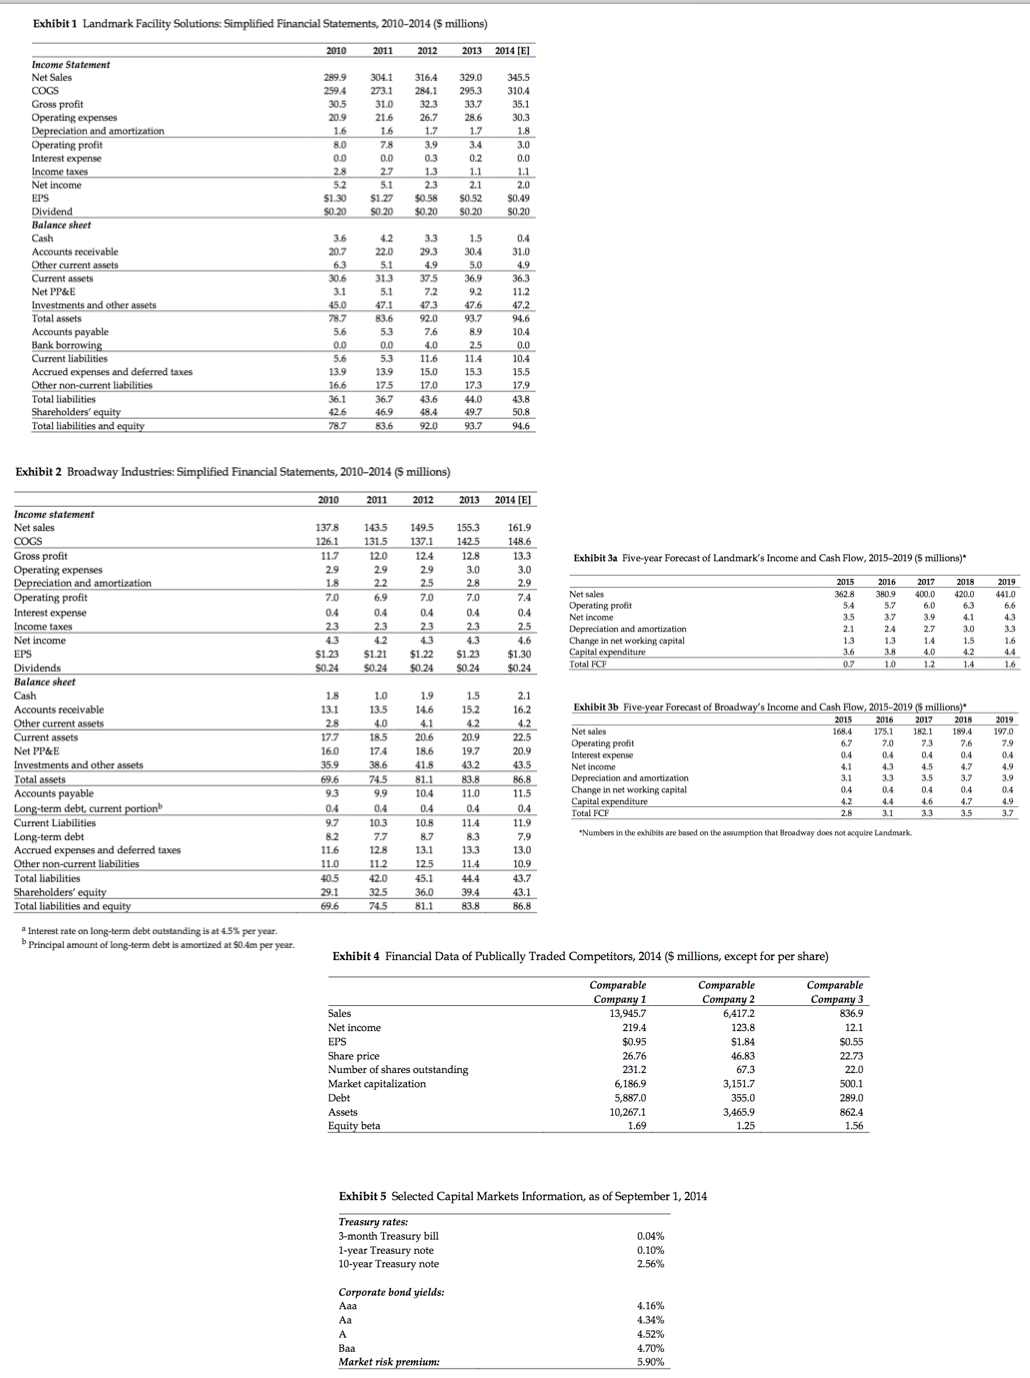
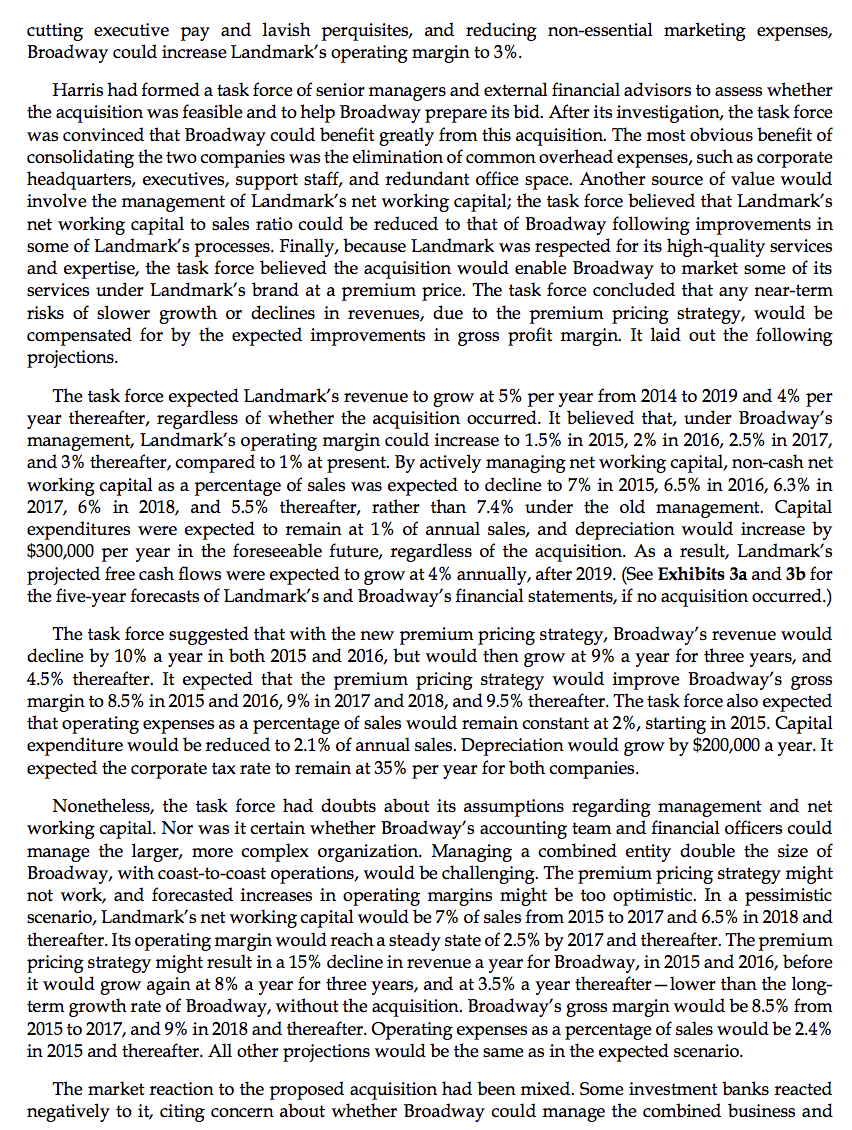
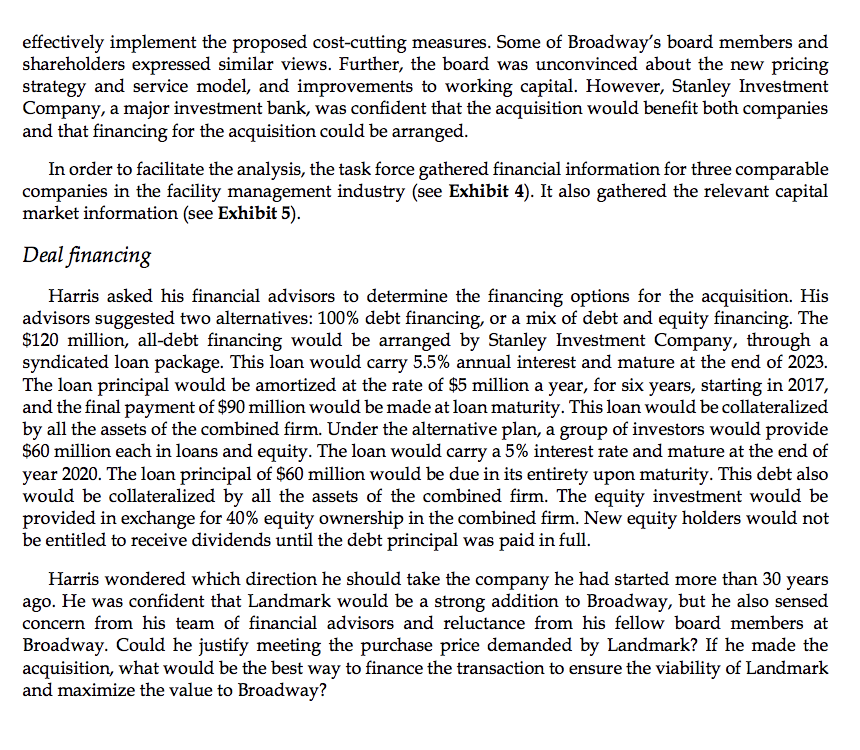
Exhibit 1 Landmark Facility Solutions: Simplified Financial Statements, 2010-2014 ($ millions) Income Statement Net Sales COGS Gross profit Operating expenses Depreciation and amortization Operating profit Interest expense Income taxes Net income EPS Dividend Balance sheet Cash Accounts receivable Other current assets Current assets Net PP&E Investments and other assets Accounts payable Bank borrowing Total assets 2010 2011 2012 289.9 259.4 30.5 20.9 1.6 8.0 0.0 2.8 5.2 $1.30 $0.20 3.6 20.7 6.3 30.6 3.1 Current liabilities Accrued expenses and deferred taxes Other non-current liabilities 45.0 78.7 5.6 0.0 5.6 13.9 16.6 36.1 42.6 Total liabilities Shareholders' equity Total liabilities and equity - | 78.7 83.6 2013 2014 [E] , |2 2 1 | - e 345.5 310.4 35.1 30.3 1.8 3.0 0.0 1.1 2.0 $0.49 $0.20 0.4 31.0 4.9 36.3 11.2 47.2 94.6 10.4 0.0 10.4 15.5 17.9 43.8 50.8 94.6 Exhibit 2 Broadway Industries: Simplified Financial Statements, 2010-2014 ($ millions) 2010 2011 2012 2013 2014 [E] Income statement Net sales 137.8 143.5 149.5 155.3 161.9 COGS 126.1 131.5 137.1 142.5 148.6 Gross profit 11.7 12.0 12.4 12.8 13.3 Exhibit 3a Five-year Forecast of Landmark's Income and Cash Flow, 2015-2019 (S millions)* Operating expenses 2.9 2.9 2.9 3.0 3.0 Depreciation and amortization 1.8 2.2 2.5 2.8 2.9 2015 2016 2017 2018 2019 Operating profit 7.0 6.9 7.0 7.0 7.4 Net sales 362.8 380.9 Interest expense Operating profit 5.4 5.7 6.0 6.3 6.6 04 0.4 0.4 0.4 0.4 Net income 3.7 4.3 Income taxes. Net income EPS Dividends Balance sheet Cash Accounts receivable Other current assets Current assets Net PP&E Total assets 2.3 2.3 2.3 2.3 2.5 Depreciation and amortization 2.1 24 2.7 3.0 3.3 4.3 4.2 4.3 4.3 4.6 Change in net working capital 1.3 1.3 1.4 1.6 $1.23 $1.21 $1.22 $1.23 $1.30 Capital expenditure 3.6 3.8 4.0 4.2 44 $0.24 $0.24 $0.24 $0.24 $0.24 Total FCR 1.0 1.2 1.4 1.8 1.0 1.9 1.5 2.1 13.1 13.5 14.6 15.2 16.2 Exhibit 3b Five-year Forecast of Broadway's Income and Cash Flow, 2015-2019 ($ millions)* 28 4.0 4.1 4.2 2016 4.2 2017 2018 2019 Net sales 168.4 175.1 182.1 189.4 197.0 17.7 18.5 20.6 20.9 22.5 Operating profit 6.7 7.0 7.3 7.6 7.9 16.0 174 18.6 19.7 20.9 Interest expense 0.4 0.4 0.4 0.4 0.4 Investments and other assets 35.9 38.6 41.8 43.2 43.5 Net income 4.1 4.3 4.5 4.7 4.9 69.6 74.5 81.1 83.8 86.8 Depreciation and amortization 3.1 3.3 3.5 3.7 3.9 Accounts payable 9.3 9.9 10.4 11.0 11.5 Change in net working capital 0.4 0.4 0.4 0.4 0.4 Long-term debt, current portion Capital expenditure 4.4 4.6 4.7 0.4 0.4 0.4 0.4 0.4 Total FCF 3.1 3.3 3.5 3.7 Current Liabilities 9.7 10.3 11.4 11.9 Long-term debt 8.2 7.7 87 8.3 7.9 "Numbers in the exhibits are based on the assumption that Broadway does not acquire Landmark Accrued expenses and deferred taxes 11.6 12.8 13.1 13.3 13.0 Other non-current liabilities 11.0 11.2 12.5 114 10.9 Total liabilities 40.5 42.0 45.1 44.4 43.7 Shareholders' equity 29.1 32.5 36.0 39.4 43.1 Total liabilities and equity 69.6 74.5 81.1 83.8 86.8 a Interest rate on long-term debt outstanding is at 4.5% per year. b Principal amount of long-term debt is amortized at $0.4m per year. Exhibit 4 Financial Data of Publically Traded Competitors, 2014 ($ millions, except for per share) Comparable Company 1 Comparable Company 2 Comparable Company 3 Sales 13,945.7 6,417.2 836.9 Net income 219.4 123.8 12.1 EPS $0.95 $1.84 $0.55 Share price 26.76 46.83 22.73 Number of shares outstanding 231.2 67.3 22.0 Market capitalization 6,186.9 3,151.7 500.1 Debt 5,887.0 355.0 289.0 Assets 10,267.1 3,465,9 862.4 Equity beta 1.69 1.25 1.56 Exhibit 5 Selected Capital Markets Information, as of September 1, 2014 Treasury rates: 3-month Treasury bill 1-year Treasury note 10-year Treasury note 0.04% 0.10% 2.56% Corporate bond yields: Aaa 4.16% Aa 4.34% A 4.52% Baa 4.70% Market risk premium: 5.90%
Step by Step Solution
There are 3 Steps involved in it
Step: 1

Get Instant Access to Expert-Tailored Solutions
See step-by-step solutions with expert insights and AI powered tools for academic success
Step: 2

Step: 3
Ace Your Homework with AI
Get the answers you need in no time with our AI-driven, step-by-step assistance
Get Started
Financial Reporting Financial Statement Analysis And Valuation A Strategic Perspective
Authors: James M. Wahlen, Stephen P. Baginski, Mark Bradshaw
8th Edition
1285190904, 978-1305176348, 1305176340, 978-1285190907