

Answered step by step
Verified Expert Solution
Question
1 Approved Answer
What is the suggested allocation for AMZN stock? 2.4002 0.00432 1.05203 0.1170 Spy is the proxy. There are three securities (AAPL, MSFT, and AMZN). Use
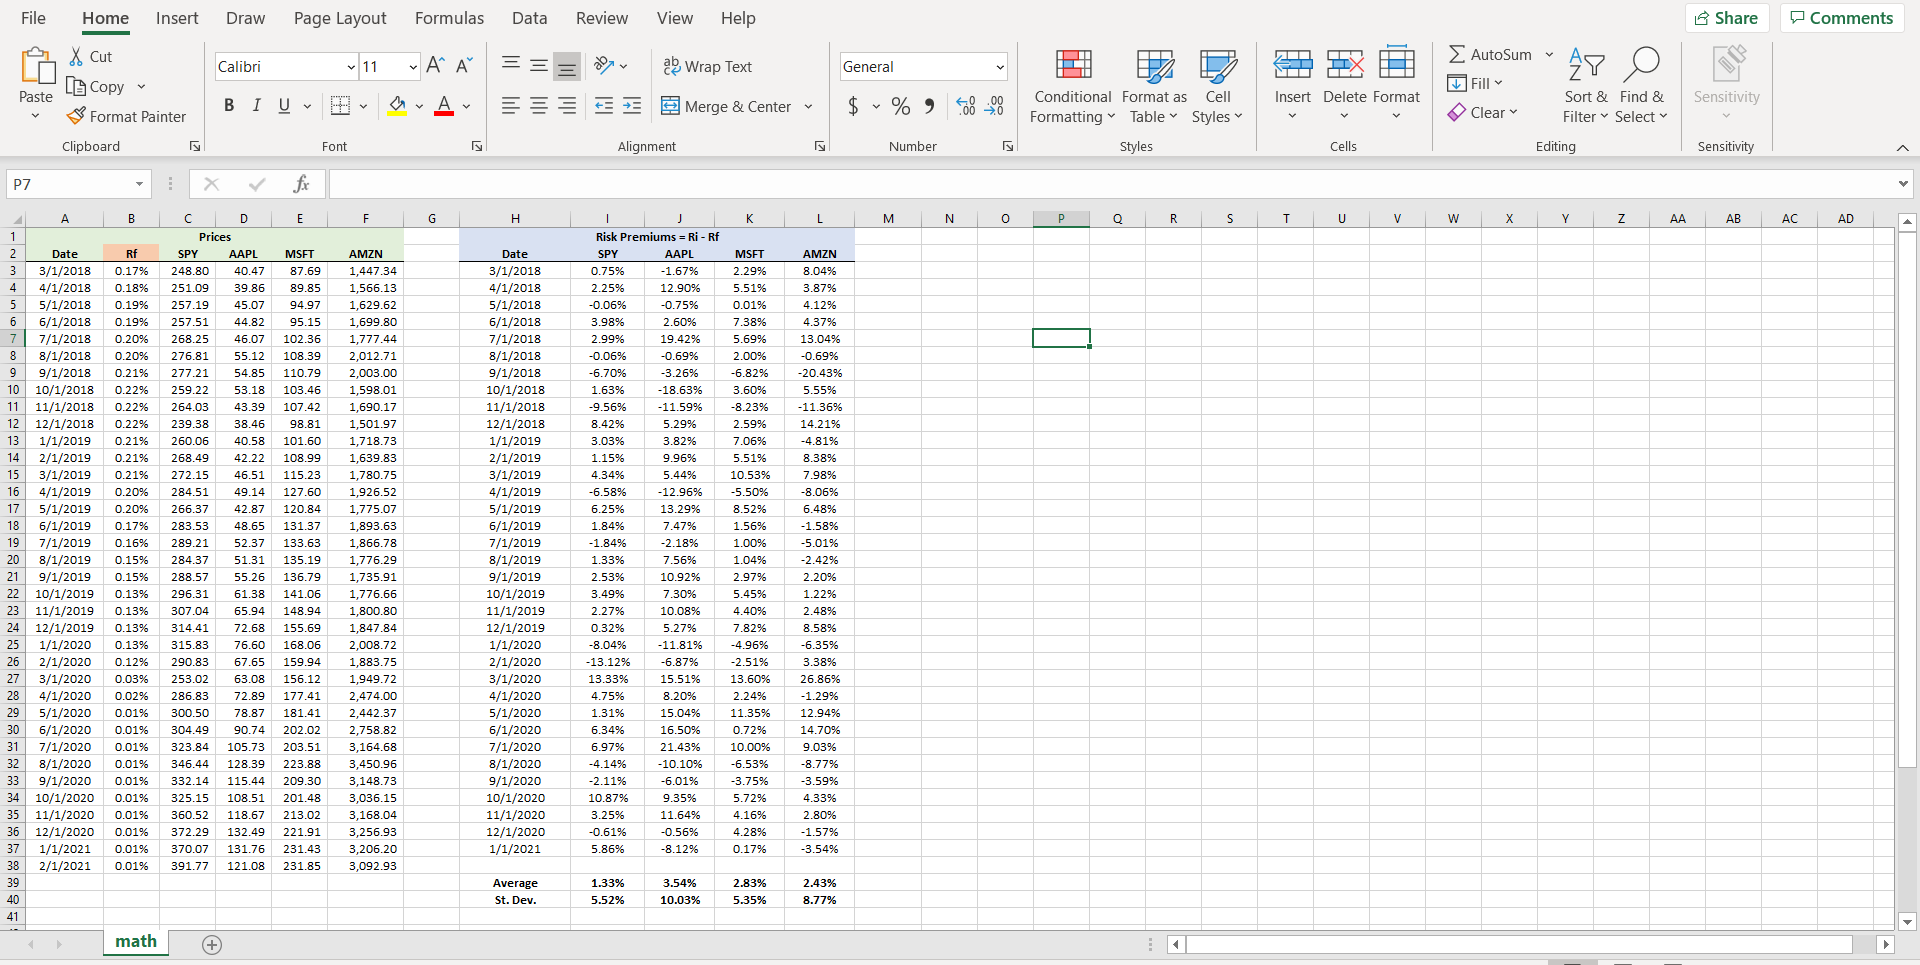
- What is the suggested allocation for AMZN stock?
- 2.4002
- 0.00432
- 1.05203
- 0.1170
Spy is the proxy. There are three securities (AAPL, MSFT, and AMZN). Use regression approach. Please show excel formulas/steps.
File Home Insert Draw Page Layout Formulas Data Review View Help Share Comments AutoSum of Cut Lo Copy Calibri 11 ~ A ab Wrap Text General AY Fill Paste BIU Insert Delete Format Sensitivity Merge & Center $ % Conditional Format as Cell Formatting Table Styles Sort & Find & Filter Select Format Painter Clear Clipboard Font Alignment Number Styles Cells Editing Sensitivity P7 fic B E F H L M N o 0 R s V w Y Z AA AB AC AD 251.09 1 2 Date 3 3/1/2018 4 4/1/2018 5 5/1/2018 6 6/1/2018 7 7/1/2018 8 8/1/2018 9 9/1/2018 10 10/1/2018 11 11/1/2018 12 12/1/2018 13 1/1/2019 14 2/1/2019 15 3/1/2019 16 4/1/2019 17 5/1/2019 18 6/1/2019 19 7/1/2019 20 8/1/2019 21 9/1/2019 22 10/1/2019 23 11/1/2019 24 12/1/2019 25 1/1/2020 26 2/1/2020 27 3/1/2020 28 4/1/2020 29 5/1/2020 30 6/1/2020 31 7/1/2020 32 8/1/2020 33 9/1/2020 34 10/1/2020 35 11/1/2020 36 12/1/2020 37 1/1/2021 38 2/1/2021 39 40 41 Rf 0.1796 0.18% 0.19% 0.19% 0.20% 0.20% 0.21% 0.22% 0.22% 0.229 0.21% 0.21% 0.21% 0.20% 0.20% 0.17% 0.16% 0.15% 0.15% 0.13% 0.13% 0.13% 0.13% 0.12% 0.03% 0.02% 0.01% C D Prices SPY AAPL 248.80 40.47 39.86 257.19 45.07 257.51 44.82 268.25 46.07 276.81 55.12 277.21 54.85 259.22 53.18 264.03 43.39 239.38 38.46 260.06 40.58 268.49 42.22 272.15 46.51 284.51 49.14 266.37 42.87 283.53 48.65 289.21 52.37 284.37 51.31 288.57 55.26 296.31 61.38 307.04 65.94 72.68 315.83 76.60 290.83 67.65 253.02 63.08 286.83 72.89 300.50 78.87 304.49 90.74 323.84 105.73 346.44 128.39 332.14 115.44 325.15 108.51 360.52 118.67 372.29 132.49 370.07 131.76 391.77 121.08 MSET 87.69 89.85 9497 95.15 102.36 108.39 110.79 103.46 107.42 98.81 101.60 108.99 115.23 127.60 120.84 131.37 133.63 135.19 136.79 141.06 148.94 155.69 168.06 159.94 156.12 177.41 181.41 202.02 203.51 223.88 209.30 201.48 213.02 221.91 231.43 231.85 AMZN 1,447.34 1,566.13 1,629.62 1,699.80 1,777.44 2,012.71 2,003.00 1,598.01 1,690.17 1,501.97 1,718.73 1,639.83 1,780.75 1,926.52 1,775.07 1,893.63 1,866.78 1,776.29 1,735.91 1,776.66 1,800.80 1,847.84 2,008.72 1,883.75 1,949.72 2,474.00 2,442.37 2,758.82 3,164.68 3,450.96 3,148.73 3,036.15 3,168.04 3,256.93 3,206.20 3,092.93 Date 3/1/2018 4/1/2018 5/1/2018 6/1/2018 7/1/2018 8/1/2018 9/1/2018 10/1/2018 11/1/2018 12/1/2018 1/1/2019 2/1/2019 3/1/2019 4/1/2019 5/1/2019 6/1/2019 7/1/2019 8/1/2019 9/1/2019 10/1/2019 11/1/2019 12/1/2019 1/1/2020 2/1/2020 3/1/2020 4/1/2020 5/1/2020 6/1/2020 7/1/2020 8/1/2020 9/1/2020 10/1/2020 11/1/2020 12/1/2020 1/1/2021 K Risk Premiums = Ri - Rf SPY AAPL MSFT 0.75% -1.67% 2.299 2.25% 12.90% 5.51% -0.06% -0.75% 0.01% 3.98% 2.60% 7.38% 2.99% 19.42% 5.69% -0.06% -0.69% 2.00% -6.70% -3.26% -6.82% 1.63% -18.63% 3.60% -9.56% -11.59% -8.23% 8.42% 5.29% 2.59% 3.03% 3.82% 7.06% 1.15% 9.96% 5.51% 4.34% 5.44% 10.53% -6.58% -12.96% -5.50% 6.25% 13.29% 8.52% 1.84% 7.47% 1.56% -1.84% -2.18% 1.00% 1.33% 7.56% 1.04% 2.53% 10.92% 2.97% 3.49% 7.30% 5.45% 2.27% 10.08% 4.40% 0.32% 7.82% -8.04% -11.81% -4.96% -13.12% -6.87% -2.51% 13.33% 15.51% 13.60% 4.75% 8.20% 2.24% 1.31% 15.04% 11.35% 6.3496 16.50% 0.72% 6.97% 21.43% 10.00% -4.14% -10.10% -2.11% -6.01% -3.75% 10.87% 9.35% 5.72% 3.25% 11.64% 4.16% -0.61% -0.56% 4.28% 5.86% -8.12% 0.17% AMZN 8.04% 3.87% 4.12% 4.37% 13.04% -0.69% -20.43% 5.55% -11.36% 14.21% -4.81% 8.38% 7.98% -8.06% 6.48% -1.58% -5.01% -2.42% 2.20% 1.22% 2.48% 8.58% -6.35% 3.38% 26.86% -1.29% 12.94% 14.70% 9.03% -8.77% -3.59% 4.33% 2.80% -1.57% -3.54% 314.41 5.27% -6.53% 0.01% 0.01% 0.01% 0.01% 0.01% 0.01% 0.01% 0.01% 0.01% Average St. Dev. 1.33% 5.52% 3.54% 10.03% 2.83% 5.35% 2.43% 8.77% math (+ File Home Insert Draw Page Layout Formulas Data Review View Help Share Comments AutoSum of Cut Lo Copy Calibri 11 ~ A ab Wrap Text General AY Fill Paste BIU Insert Delete Format Sensitivity Merge & Center $ % Conditional Format as Cell Formatting Table Styles Sort & Find & Filter Select Format Painter Clear Clipboard Font Alignment Number Styles Cells Editing Sensitivity P7 fic B E F H L M N o 0 R s V w Y Z AA AB AC AD 251.09 1 2 Date 3 3/1/2018 4 4/1/2018 5 5/1/2018 6 6/1/2018 7 7/1/2018 8 8/1/2018 9 9/1/2018 10 10/1/2018 11 11/1/2018 12 12/1/2018 13 1/1/2019 14 2/1/2019 15 3/1/2019 16 4/1/2019 17 5/1/2019 18 6/1/2019 19 7/1/2019 20 8/1/2019 21 9/1/2019 22 10/1/2019 23 11/1/2019 24 12/1/2019 25 1/1/2020 26 2/1/2020 27 3/1/2020 28 4/1/2020 29 5/1/2020 30 6/1/2020 31 7/1/2020 32 8/1/2020 33 9/1/2020 34 10/1/2020 35 11/1/2020 36 12/1/2020 37 1/1/2021 38 2/1/2021 39 40 41 Rf 0.1796 0.18% 0.19% 0.19% 0.20% 0.20% 0.21% 0.22% 0.22% 0.229 0.21% 0.21% 0.21% 0.20% 0.20% 0.17% 0.16% 0.15% 0.15% 0.13% 0.13% 0.13% 0.13% 0.12% 0.03% 0.02% 0.01% C D Prices SPY AAPL 248.80 40.47 39.86 257.19 45.07 257.51 44.82 268.25 46.07 276.81 55.12 277.21 54.85 259.22 53.18 264.03 43.39 239.38 38.46 260.06 40.58 268.49 42.22 272.15 46.51 284.51 49.14 266.37 42.87 283.53 48.65 289.21 52.37 284.37 51.31 288.57 55.26 296.31 61.38 307.04 65.94 72.68 315.83 76.60 290.83 67.65 253.02 63.08 286.83 72.89 300.50 78.87 304.49 90.74 323.84 105.73 346.44 128.39 332.14 115.44 325.15 108.51 360.52 118.67 372.29 132.49 370.07 131.76 391.77 121.08 MSET 87.69 89.85 9497 95.15 102.36 108.39 110.79 103.46 107.42 98.81 101.60 108.99 115.23 127.60 120.84 131.37 133.63 135.19 136.79 141.06 148.94 155.69 168.06 159.94 156.12 177.41 181.41 202.02 203.51 223.88 209.30 201.48 213.02 221.91 231.43 231.85 AMZN 1,447.34 1,566.13 1,629.62 1,699.80 1,777.44 2,012.71 2,003.00 1,598.01 1,690.17 1,501.97 1,718.73 1,639.83 1,780.75 1,926.52 1,775.07 1,893.63 1,866.78 1,776.29 1,735.91 1,776.66 1,800.80 1,847.84 2,008.72 1,883.75 1,949.72 2,474.00 2,442.37 2,758.82 3,164.68 3,450.96 3,148.73 3,036.15 3,168.04 3,256.93 3,206.20 3,092.93 Date 3/1/2018 4/1/2018 5/1/2018 6/1/2018 7/1/2018 8/1/2018 9/1/2018 10/1/2018 11/1/2018 12/1/2018 1/1/2019 2/1/2019 3/1/2019 4/1/2019 5/1/2019 6/1/2019 7/1/2019 8/1/2019 9/1/2019 10/1/2019 11/1/2019 12/1/2019 1/1/2020 2/1/2020 3/1/2020 4/1/2020 5/1/2020 6/1/2020 7/1/2020 8/1/2020 9/1/2020 10/1/2020 11/1/2020 12/1/2020 1/1/2021 K Risk Premiums = Ri - Rf SPY AAPL MSFT 0.75% -1.67% 2.299 2.25% 12.90% 5.51% -0.06% -0.75% 0.01% 3.98% 2.60% 7.38% 2.99% 19.42% 5.69% -0.06% -0.69% 2.00% -6.70% -3.26% -6.82% 1.63% -18.63% 3.60% -9.56% -11.59% -8.23% 8.42% 5.29% 2.59% 3.03% 3.82% 7.06% 1.15% 9.96% 5.51% 4.34% 5.44% 10.53% -6.58% -12.96% -5.50% 6.25% 13.29% 8.52% 1.84% 7.47% 1.56% -1.84% -2.18% 1.00% 1.33% 7.56% 1.04% 2.53% 10.92% 2.97% 3.49% 7.30% 5.45% 2.27% 10.08% 4.40% 0.32% 7.82% -8.04% -11.81% -4.96% -13.12% -6.87% -2.51% 13.33% 15.51% 13.60% 4.75% 8.20% 2.24% 1.31% 15.04% 11.35% 6.3496 16.50% 0.72% 6.97% 21.43% 10.00% -4.14% -10.10% -2.11% -6.01% -3.75% 10.87% 9.35% 5.72% 3.25% 11.64% 4.16% -0.61% -0.56% 4.28% 5.86% -8.12% 0.17% AMZN 8.04% 3.87% 4.12% 4.37% 13.04% -0.69% -20.43% 5.55% -11.36% 14.21% -4.81% 8.38% 7.98% -8.06% 6.48% -1.58% -5.01% -2.42% 2.20% 1.22% 2.48% 8.58% -6.35% 3.38% 26.86% -1.29% 12.94% 14.70% 9.03% -8.77% -3.59% 4.33% 2.80% -1.57% -3.54% 314.41 5.27% -6.53% 0.01% 0.01% 0.01% 0.01% 0.01% 0.01% 0.01% 0.01% 0.01% Average St. Dev. 1.33% 5.52% 3.54% 10.03% 2.83% 5.35% 2.43% 8.77% math (+Step by Step Solution
There are 3 Steps involved in it
Step: 1

Get Instant Access to Expert-Tailored Solutions
See step-by-step solutions with expert insights and AI powered tools for academic success
Step: 2

Step: 3
Ace Your Homework with AI
Get the answers you need in no time with our AI-driven, step-by-step assistance
Get Started
Accounting Ledger Book
Authors: Alpha Planners Publishing
1st Edition
B09VWKPJSG, 979-8432472564