What is the three-sigma level upper control limit for R-chart? (Answer in two decimal points)
What is the three-sigma level lower control limit for R-chart? (Answer with a whole number.)
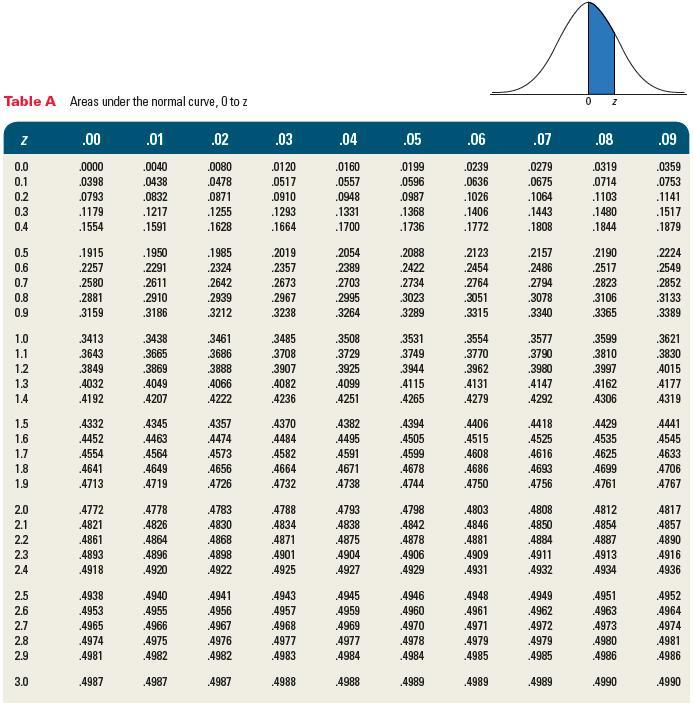
Table A Areas under the normal curve, 0 to z 0 .00 .01 .02 103 .04 05 06 07 08 .09 0359 0.0 0000 0040 0080 0120 0160 0199 0239 .0279 0319 0.1 0398 0438 0478 0517 0557 0596 0636 0675 0714 0753 0.2 0793 0832 0871 0910 0948 0987 1026 .1064 1103 .1141 0.3 .1179 1217 .1255 1293 1331 1368 .1406 .1443 1480 .1517 0.4 .1554 .1591 .1628 .1664 1700 .1736 .1772 .1808 .1844 .1879 0.5 .1915 .1950 1985 2019 2054 2088 .2123 .2157 2190 2224 0.6 2257 2291 .2324 2357 2389 .2422 2454 .2486 .2517 2549 0.7 .2580 .2611 .2642 2673 2703 2734 2764 2794 .2823 .2852 0.8 2881 2910 2939 2967 2995 3023 3051 3078 3106 3133 0.9 3159 3186 .3212 3238 3264 3289 3315 .3340 3365 3389 1.0 3413 .3438 .3461 3485 .3508 .3531 3554 3577 3599 3621 1.1 3643 3665 3686 370 3729 .3749 .3770 .3790 3810 3830 1.2 3849 3869 3888 3907 3925 .3944 .3962 3980 3997 4015 1.3 4032 4049 4066 4082 4099 4115 4131 4147 4162 4177 14 4192 4207 4222 4236 4251 4265 .4279 .4292 4306 .4319 1.5 4332 4345 4357 4370 1382 1394 4406 4418 4429 4441 1.6 4452 4463 4474 4484 4495 4505 4515 .4525 4535 4545 1.7 4554 4564 4573 4582 4591 4599 4608 4616 4625 .4633 1.8 4641 4649 4656 4664 4671 4678 4686 4693 4699 4706 1.9 4713 4719 4726 4732 4738 4744 4750 4756 4761 4767 2.0 .4772 4778 4783 4788 4793 4798 4803 4808 4812 4817 2.1 4821 4826 4830 4834 1838 4842 4846 4850 4854 4857 2.2 4861 4864 4868 4871 4875 4878 4881 4884 1887 4890 2.3 1893 4896 4898 4901 1904 4906 4909 4911 4913 4916 2.4 .4918 4920 .4922 4925 4927 .4929 4931 .4932 4934 .4936 2.5 1938 4940 .4941 4943 4945 .4946 4948 .4949 .4951 4952 2.6 4953 4955 4956 4957 4959 4960 .4961 4962 .4963 4964 2.7 4965 4966 .4967 .4968 4969 4970 .4971 .4972 .4973 4974 2.8 .4974 4975 4976 4977 4977 4978 .4979 .4979 4980 4981 29 4981 4982 4982 .4983 1984 4984 .4985 .4985 .4986 4986 3.0 4987 4987 4987 4988 4988 .4989 .4989 4989 .4990 4990Table A Areas under the normal curve, 0 to z 0 .00 .01 .02 103 .04 05 06 07 08 .09 0359 0.0 0000 0040 0080 0120 0160 0199 0239 .0279 0319 0.1 0398 0438 0478 0517 0557 0596 0636 0675 0714 0753 0.2 0793 0832 0871 0910 0948 0987 1026 .1064 1103 .1141 0.3 .1179 1217 .1255 1293 1331 1368 .1406 .1443 1480 .1517 0.4 .1554 .1591 .1628 .1664 1700 .1736 .1772 .1808 .1844 .1879 0.5 .1915 .1950 1985 2019 2054 2088 .2123 .2157 2190 2224 0.6 2257 2291 .2324 2357 2389 .2422 2454 .2486 .2517 2549 0.7 .2580 .2611 .2642 2673 2703 2734 2764 2794 .2823 .2852 0.8 2881 2910 2939 2967 2995 3023 3051 3078 3106 3133 0.9 3159 3186 .3212 3238 3264 3289 3315 .3340 3365 3389 1.0 3413 .3438 .3461 3485 .3508 .3531 3554 3577 3599 3621 1.1 3643 3665 3686 370 3729 .3749 .3770 .3790 3810 3830 1.2 3849 3869 3888 3907 3925 .3944 .3962 3980 3997 4015 1.3 4032 4049 4066 4082 4099 4115 4131 4147 4162 4177 14 4192 4207 4222 4236 4251 4265 .4279 .4292 4306 .4319 1.5 4332 4345 4357 4370 1382 1394 4406 4418 4429 4441 1.6 4452 4463 4474 4484 4495 4505 4515 .4525 4535 4545 1.7 4554 4564 4573 4582 4591 4599 4608 4616 4625 .4633 1.8 4641 4649 4656 4664 4671 4678 4686 4693 4699 4706 1.9 4713 4719 4726 4732 4738 4744 4750 4756 4761 4767 2.0 .4772 4778 4783 4788 4793 4798 4803 4808 4812 4817 2.1 4821 4826 4830 4834 1838 4842 4846 4850 4854 4857 2.2 4861 4864 4868 4871 4875 4878 4881 4884 1887 4890 2.3 1893 4896 4898 4901 1904 4906 4909 4911 4913 4916 2.4 .4918 4920 .4922 4925 4927 .4929 4931 .4932 4934 .4936 2.5 1938 4940 .4941 4943 4945 .4946 4948 .4949 .4951 4952 2.6 4953 4955 4956 4957 4959 4960 .4961 4962 .4963 4964 2.7 4965 4966 .4967 .4968 4969 4970 .4971 .4972 .4973 4974 2.8 .4974 4975 4976 4977 4977 4978 .4979 .4979 4980 4981 29 4981 4982 4982 .4983 1984 4984 .4985 .4985 .4986 4986 3.0 4987 4987 4987 4988 4988 .4989 .4989 4989 .4990 4990