What is the weighted average cost of capital for Marriott Corp?
What risk-free rate and risk premium did you use to calculate the cost of equity?
How did you measure Marriotts cost of debt?
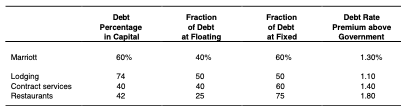
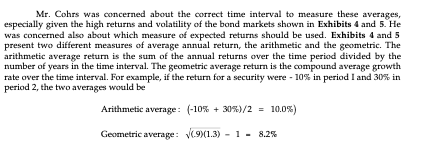
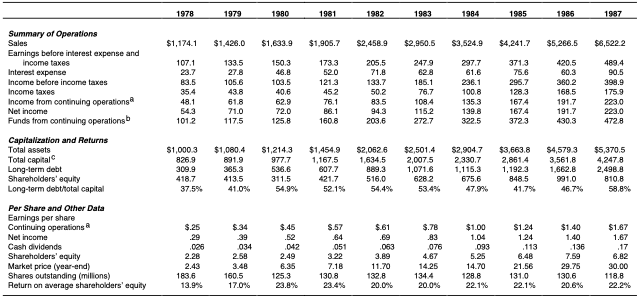
Fraction Debt Percentage in Capital of Debt at Floating Fraction of Debt at Fixed Debt Rate Premium above Government Marriott 60% 40% 1.30% 1.10 Lodging Contract services Restaurants 180 Mr. Cohrs was concerned about the correct time interval to measure these averages, especially given the high returns and volatility of the bond markets shown in Exhibits 4 and 5. He was concerned also about which measure of expected returns should be used. Exhibits 4 and 5 present two different measures of average annual return, the arithmetic and the geometric. The arithmetic average return is the sum of the annual returns over the time period divided by the number of years in the time interval. The geometric average return is the compound average growth rate over the time interval. For example, if the return for a security were -10% in period 1 and 30% in period 2, the two averages would be Arithmetic average : (-10% + 30%)/2 = 10.0%) Geometric average: .9/1.3) - 1 - 8.2% 1978 1979 1980 1981 1982 1983 1984 1985 1986 1987 $1,174.1 $1.426.0 $1,633.9 $1,905.7 $2,458.9 $2,950.5 $3,524.9 $4,241.7 $5,266.5 $6,522.2 107.1 150,3 1733 2479 133.5 27.8 205,5 71.8 297.7 61.6 3713 75.6 4894 90.5 Summary of Operations Sales Earnings before interest expense and income taxes Interest expense Income before income taxes Income taxes Income from continuing operations Net income Funds from continuing operationsb 23.7 46.8 62.8 43.8 40,6 452 50.2 35.4 48.1 100.8 420.5 60.3 360.2 168.5 191.7 191.7 430.3 128.3 1674 167.4 3723 710 1759 2230 223.0 4728 720 1084 115.2 2727 06.1 160.8 1353 139.8 322.5 1012 943 203.6 117.5 125.8 $1,080.4 891. 9 Capitallation and Returns Total assets Total capital Long-term debt Shareholders' equity Long-term debtotal capital $1.000 3 826.9 309.9 418.7 37.5% 365.3 $1,214.3 9 777 536.6 311.5 54.9% $1.4549 1,167,5 607.7 421.7 521% $2,0626 1,634 5 889. 3 516,0 54,4% $2,501.4 $2,904.7 2.00752330.7 1 ,071.6 1.115.3 628 2 675.6 53 4 4 7,9% $3,663.8 2.8614 1.1923 848.5 41.7% $4,579.3 3.561,8 1.662.8 991,0 46.7% $5,370.5 4,247 8 2.498.8 8108 588% 4135 41.0% $.25 $.45 $ 57 $ 61 $.78 $1.40 1.40 $1.67 1.67 Per Share and Other Data Earnings per share Continuing operations & Nel income Cash dividends Shareholders' equity Market price (year-end) Shares outstanding (milions) Return on average shareholders' equity 034 2.58 051 3.22 042 2.49 8.35 125,3 23.8% 063 3.89 11.70 076 4.67 14.25 1344 20.0% $1.00 1.04 093 5.25 14.70 1288 39 1 22.1% $1.24 1.24 113 6.48 21.56 131.0 22.1% 7.59 29.75 130.8 1306 1836 13.9% 160.5 17.0% 30.00 118.8 22.2% 20.0% 20.6% Fraction Debt Percentage in Capital of Debt at Floating Fraction of Debt at Fixed Debt Rate Premium above Government Marriott 60% 40% 1.30% 1.10 Lodging Contract services Restaurants 180 Mr. Cohrs was concerned about the correct time interval to measure these averages, especially given the high returns and volatility of the bond markets shown in Exhibits 4 and 5. He was concerned also about which measure of expected returns should be used. Exhibits 4 and 5 present two different measures of average annual return, the arithmetic and the geometric. The arithmetic average return is the sum of the annual returns over the time period divided by the number of years in the time interval. The geometric average return is the compound average growth rate over the time interval. For example, if the return for a security were -10% in period 1 and 30% in period 2, the two averages would be Arithmetic average : (-10% + 30%)/2 = 10.0%) Geometric average: .9/1.3) - 1 - 8.2% 1978 1979 1980 1981 1982 1983 1984 1985 1986 1987 $1,174.1 $1.426.0 $1,633.9 $1,905.7 $2,458.9 $2,950.5 $3,524.9 $4,241.7 $5,266.5 $6,522.2 107.1 150,3 1733 2479 133.5 27.8 205,5 71.8 297.7 61.6 3713 75.6 4894 90.5 Summary of Operations Sales Earnings before interest expense and income taxes Interest expense Income before income taxes Income taxes Income from continuing operations Net income Funds from continuing operationsb 23.7 46.8 62.8 43.8 40,6 452 50.2 35.4 48.1 100.8 420.5 60.3 360.2 168.5 191.7 191.7 430.3 128.3 1674 167.4 3723 710 1759 2230 223.0 4728 720 1084 115.2 2727 06.1 160.8 1353 139.8 322.5 1012 943 203.6 117.5 125.8 $1,080.4 891. 9 Capitallation and Returns Total assets Total capital Long-term debt Shareholders' equity Long-term debtotal capital $1.000 3 826.9 309.9 418.7 37.5% 365.3 $1,214.3 9 777 536.6 311.5 54.9% $1.4549 1,167,5 607.7 421.7 521% $2,0626 1,634 5 889. 3 516,0 54,4% $2,501.4 $2,904.7 2.00752330.7 1 ,071.6 1.115.3 628 2 675.6 53 4 4 7,9% $3,663.8 2.8614 1.1923 848.5 41.7% $4,579.3 3.561,8 1.662.8 991,0 46.7% $5,370.5 4,247 8 2.498.8 8108 588% 4135 41.0% $.25 $.45 $ 57 $ 61 $.78 $1.40 1.40 $1.67 1.67 Per Share and Other Data Earnings per share Continuing operations & Nel income Cash dividends Shareholders' equity Market price (year-end) Shares outstanding (milions) Return on average shareholders' equity 034 2.58 051 3.22 042 2.49 8.35 125,3 23.8% 063 3.89 11.70 076 4.67 14.25 1344 20.0% $1.00 1.04 093 5.25 14.70 1288 39 1 22.1% $1.24 1.24 113 6.48 21.56 131.0 22.1% 7.59 29.75 130.8 1306 1836 13.9% 160.5 17.0% 30.00 118.8 22.2% 20.0% 20.6%