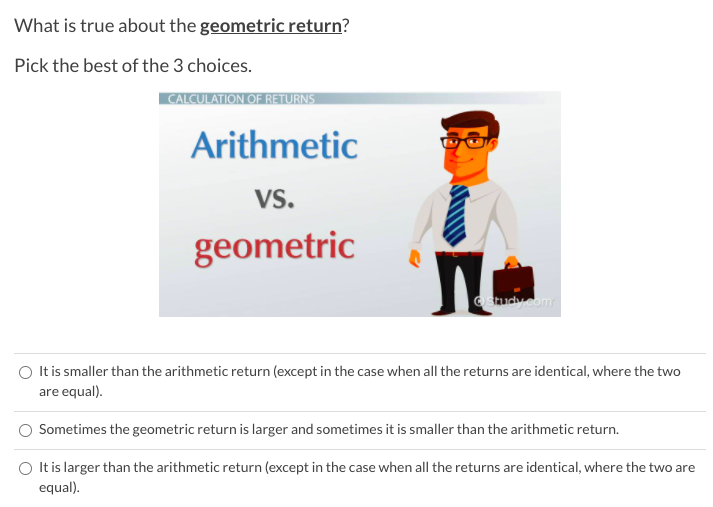
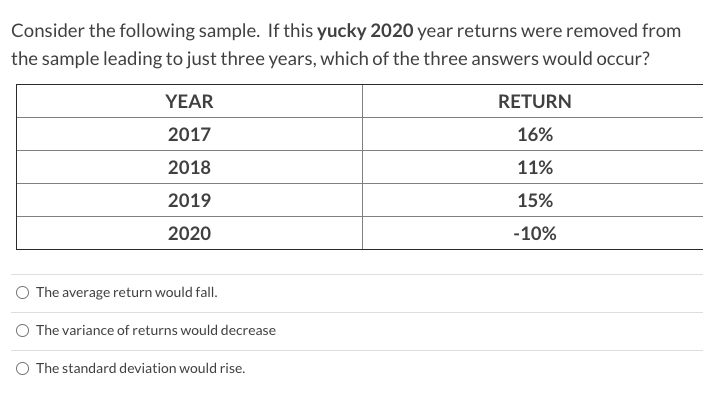
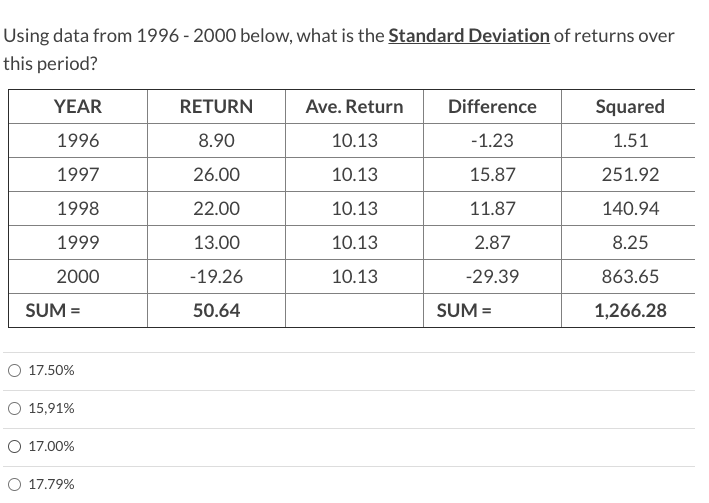
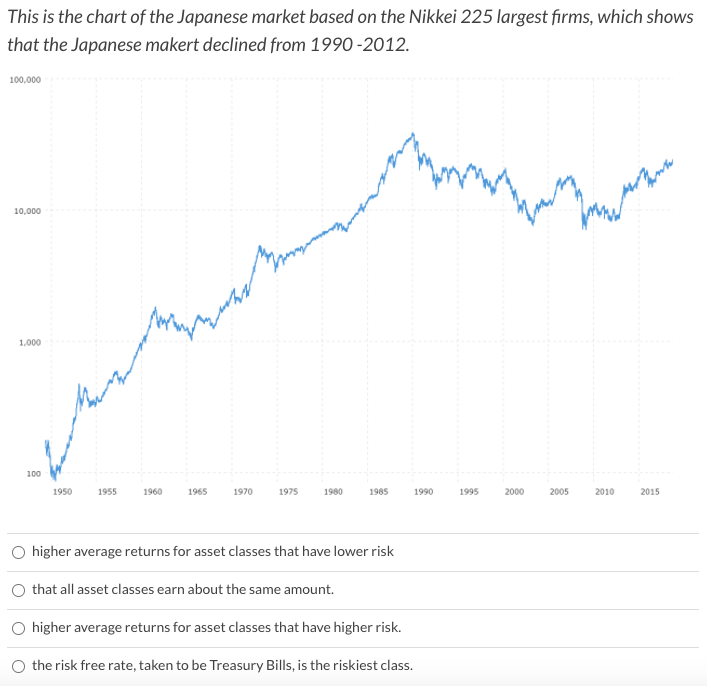
What is true about the geometric return? Pick the best of the 3 choices. CALCULATION OF RETURNS Arithmetic VS. geometric tudi.com It is smaller than the arithmetic return (except in the case when all the returns are identical, where the two are equal). Sometimes the geometric return is larger and sometimes it is smaller than the arithmetic return. It is larger than the arithmetic return (except in the case when all the returns are identical, where the two are equal). You invested in one share of stock in your Robinhood Account with a share price of $23. [Wow, what a mighty investor you are!] It paid a dividend of $.50 over the one year you owned it and then you sold the stock for $27.37 in a year. Ignore brokerage fees and taxes. Of course, Robinhood doesn't charge brokerage fees anyway. What is both your total dollar return and your total percentage return? [You are not a gazillionaire yet!) robinhood Total dollar return of $.37 and total percentage return of 1.94%. Total dollar return of $4.37 and total percentage return of 19%. Total dollar return of $4.87 and total percentage return of 21.17%. Total dollar return of $.50 and total percentage return of 2.89%. Consider the following sample. If this yucky 2020 year returns were removed from the sample leading to just three years, which of the three answers would occur? RETURN 16% YEAR 2017 2018 2019 11% 15% 2020 - 10% The average return would fall. The variance of returns would decrease The standard deviation would rise. Using data from 1996-2000 below, what is the Standard Deviation of returns over this period? YEAR RETURN Ave. Return Difference -1.23 Squared 1.51 1996 8.90 10.13 1997 26.00 10.13 15.87 251.92 1998 22.00 10.13 11.87 140.94 1999 13.00 10.13 2.87 8.25 2000 -19.26 10.13 863.65 -29.39 SUM= SUM= 50.64 1,266.28 O 17.50% O 15,91% O 17.00% O 17.79% This is the chart of the Japanese market based on the Nikkei 225 largest firms, which shows that the Japanese makert declined from 1990-2012. 100.000 10,000 My Mind Masinan 1.000 Ming therand 100 1950 1955 1960 1965 1970 1975 1980 1985 1990 1995 2000 2005 2010 2015 higher average returns for asset classes that have lower risk that all asset classes earn about the same amount. higher average returns for asset classes that have higher risk. the risk free rate, taken to be Treasury Bills, is the riskiest class. What is true about the geometric return? Pick the best of the 3 choices. CALCULATION OF RETURNS Arithmetic VS. geometric tudi.com It is smaller than the arithmetic return (except in the case when all the returns are identical, where the two are equal). Sometimes the geometric return is larger and sometimes it is smaller than the arithmetic return. It is larger than the arithmetic return (except in the case when all the returns are identical, where the two are equal). You invested in one share of stock in your Robinhood Account with a share price of $23. [Wow, what a mighty investor you are!] It paid a dividend of $.50 over the one year you owned it and then you sold the stock for $27.37 in a year. Ignore brokerage fees and taxes. Of course, Robinhood doesn't charge brokerage fees anyway. What is both your total dollar return and your total percentage return? [You are not a gazillionaire yet!) robinhood Total dollar return of $.37 and total percentage return of 1.94%. Total dollar return of $4.37 and total percentage return of 19%. Total dollar return of $4.87 and total percentage return of 21.17%. Total dollar return of $.50 and total percentage return of 2.89%. Consider the following sample. If this yucky 2020 year returns were removed from the sample leading to just three years, which of the three answers would occur? RETURN 16% YEAR 2017 2018 2019 11% 15% 2020 - 10% The average return would fall. The variance of returns would decrease The standard deviation would rise. Using data from 1996-2000 below, what is the Standard Deviation of returns over this period? YEAR RETURN Ave. Return Difference -1.23 Squared 1.51 1996 8.90 10.13 1997 26.00 10.13 15.87 251.92 1998 22.00 10.13 11.87 140.94 1999 13.00 10.13 2.87 8.25 2000 -19.26 10.13 863.65 -29.39 SUM= SUM= 50.64 1,266.28 O 17.50% O 15,91% O 17.00% O 17.79% This is the chart of the Japanese market based on the Nikkei 225 largest firms, which shows that the Japanese makert declined from 1990-2012. 100.000 10,000 My Mind Masinan 1.000 Ming therand 100 1950 1955 1960 1965 1970 1975 1980 1985 1990 1995 2000 2005 2010 2015 higher average returns for asset classes that have lower risk that all asset classes earn about the same amount. higher average returns for asset classes that have higher risk. the risk free rate, taken to be Treasury Bills, is the riskiest class


