WHAT IT SHOULD END UP LOOKING LIKE:
EXCEL GIVEN BELOW:
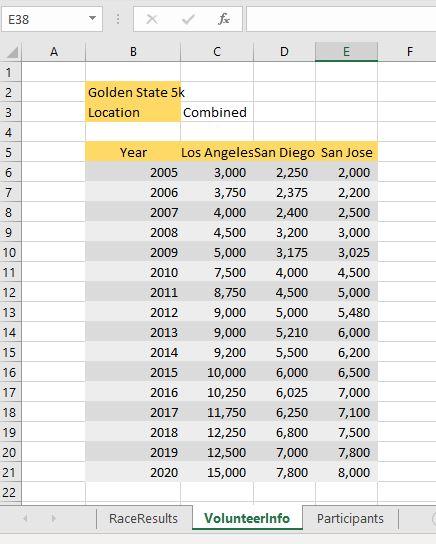
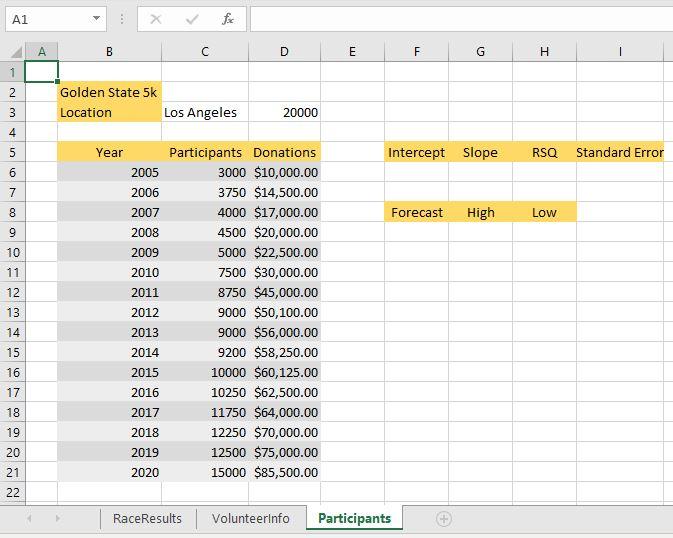
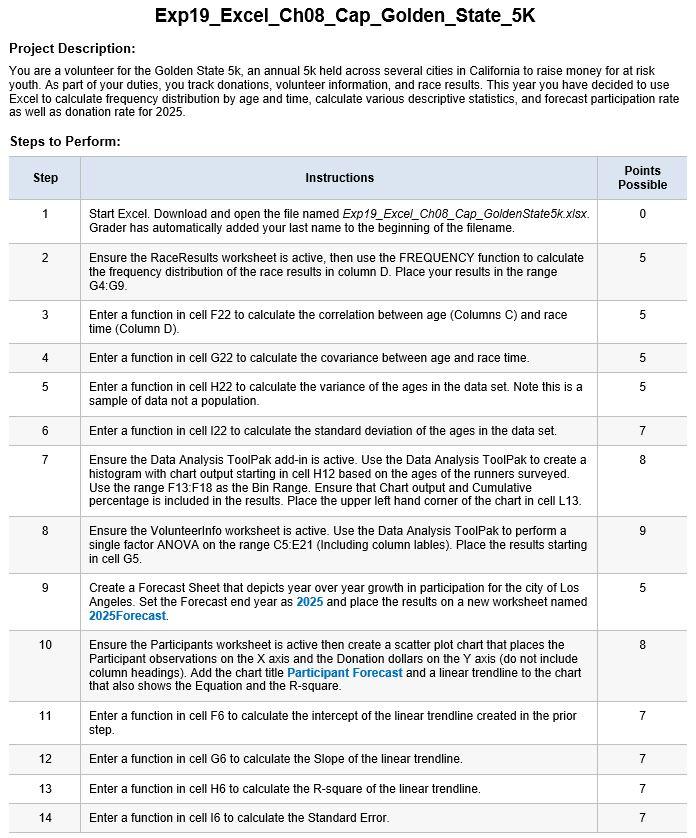
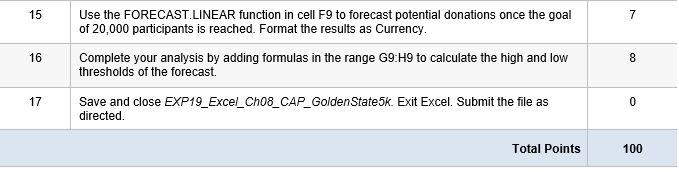
Exp19_Excel_Ch08_Cap_Golden_State_5K Project Description: You are a volunteer for the Golden State 5k, an annual 5k held across several cities in California to raise money for at risk youth. As part of your duties, you track donations, volunteer information, and race results. This year you have decided to use Excel to calculate frequency distribution by age and time, calculate various descriptive statistics, and forecast participation rate as well as donation rate for 2025. Steps to Perform Step Instructions Points Possible 1 0 2 5 3 5 4 5 5 Start Excel. Download and open the file named Exp19_Excel_Cho8_Cap_Golden State 5k.xlsx. Grader has automatically added your last name to the beginning of the filename. Ensure the RaceResults worksheet is active, then use the FREQUENCY function to calculate the frequency distribution of the race results in column D. Place your results in the range G4:49. Enter a function in cell F22 to calculate the correlation between age (Columns C) and race time (Column D). Enter a function in cell G22 to calculate the covariance between age and race time. Enter a function in cell H22 to calculate the variance of the ages in the data set. Note this is a sample of data not a population. Enter a function in cell 122 to calculate the standard deviation of the ages in the data set. Ensure the Data Analysis ToolPak add-in is active. Use the Data Analysis ToolPak to create a histogram with chart output starting in cell H12 based on the ages of the runners surveyed. Use the range F13:F18 as the Bin Range. Ensure that Chart output and Cumulative percentage is included in the results. Place the upper left hand corner of the chart in cell L13. Ensure the Volunteerinfo worksheet is active. Use the Data Analysis ToolPak to perform a single factor ANOVA on the range C5:E21 (Including column lables). Place the results starting in cell G5. 6 7 7 8 8 9 9 5 Create a Forecast Sheet that depicts year over year growth in participation for the city of Los Angeles. Set the Forecast end year as 2025 and place the results on a new worksheet named 2025Forecast 10 8 Ensure the Participants worksheet is active then create a scatter plot chart that places the Participant observations on the X axis and the Donation dollars on the Y axis (do not include column headings). Add the chart title Participant Forecast and a linear trendline to the chart that also shows the Equation and the R-square. Enter a function in cell F6 to calculate the intercept of the linear trendline created in the prior step. Enter a function in cell G6 to calculate the Slope of the linear trendline. 11 7 12 7 13 Enter a function in cell H6 to calculate the R-square of the linear trendline. 7 14 Enter a function in cell 16 to calculate the Standard Error. 7 15 7 16 8 Use the FORECAST LINEAR function in cell F9 to forecast potential donations once the goal of 20,000 participants is reached. Format the results as Currency. Complete your analysis by adding formulas in the range G9:19 to calculate the high and low thresholds of the forecast. Save and close EXP19_Excel_Ch08_CAP_Golden State5k. Exit Excel. Submit the file as directed 17 0 Total Points 100 A B D E F G H K L M N O P Q R 1 Golden State 5k Time 20 20 Runner # Age 8806 3092 6756 3768 6062 Duration Frequency 0:14:24 2 0:28:48 17 0:43:12 6 21 0:18:43 0:16:34 0:28:48 0:14:24 0:57:36 2 3 4 5 6 7 8 9 10 11 12 13 22 5 0:57:36 1:12:00 22 13 4746 22 1:26:24 2 3503 23 5 8113 23 2913 24 Age Frequency Age 18 25 18 14 8526 9205 1897 27 21 21 Histogram 27 30 30 15 16 Cumulative % 0 0.00% 3 6.00% 12 30.00% 1 32.00% 10 52.00% 12 76.00% 12 100.00% 15 3569 28 40 40 28 50 17 18 50 60 150.00% 100.00% 50.00% 0.00% 29 60 Frequency --Cumulative % 36 >60 More 43 44 0:27:22 0:22:19 0:28:48 0:17:17 0:22:19 0:27:22 0:50:52 0:25:38 0:17:43 0:16:34 0:43:12 0:57:36 1:01:12 0:19:03 1:01:12 1:04:48 0:35:17 1:03:22 0:19:03 1:04:48 1:04:48 0:33:24 More Age Correlation Covariance Variance Standard Deviation 0.5156517 0.152767 266.735 16.33201439 19 20 21 22 23 24 25 26 27 28 29 30 44 7294 3428 3299 4022 2987 9309 5215 8683 4305 5796 6689 4673 8613 9469 46 47 47 47 48 49 49 51 RaceResults Volunteerinfo 2025Forecast Participants + Calculate ED Accessibility: Investigate A1 X A B DE F G . J 1 Duration Frequency 0:14:24 0:28:48 0:43:12 0:57:36 1:12:00 1:26:24 Age 18 21 30 40 50 60 >60 2 3 4 5 6 7 8 9 10 11 12 13 14 15 16 17 18 19 20 21 22 23 24 25 26 27 28 29 30 31 32 33 34 35 36 37 38 Correlation Covariandi Variance Standard Deviation Golden State 5k Runner #Age Time 8806 20 0:18:43 3092 20 0:16:34 6756 21 0:28:48 3768 22 0:14:24 6062 22 0:57:36 4746 22 0:27:22 3503 23 0:22:19 8113 23 0:28:48 2913 24 0:17:17 8526 25 0:22:19 9205 27 0:27:22 1897 27 0:50:52 3569 28 0:25:38 7294 28 0:17:43 3428 29 0:16:34 3299 36 0:43:12 4022 43 0:57:36 2987 44 1:01:12 9309 44 0:19:03 5215 46 1:01:12 8683 47 1:04:48 4305 47 0:35:17 5796 47 1:03:22 6689 48 0:19:03 4673 49 1:04:48 8613 49 1:04:48 9469 51 0:33:24 1936 51 1:04:48 5436 55 1:37:12 4752 55 1:04:48 2398 55 1:04:48 6065 56 0:48:58 4957 57 1:04:48 6971 57 1:37:12 5885 58 1:26:24 2612 58 0:35:17 2617 59 0:48:58 7566 60 1:26:24 6377 61 0:43:12 1569 62 1:04:48 5568 62 1:37:12 2488 63 1:04:48 8206 63 0:14:24 5389 63 0:25:38 6214 66 0:17:17 1895 67 1:37:12 5038 67 1:33:36 5296 67 0:33:24 3463 68 1:04:48 7803 68 0:18:43 41 42 43 44 45 46 47 48 49 50 51 52 53 54 55 RaceResults Volunteerinfo Participants E38 A B C D E F 1 w N Golden State Sk Location Combined 4 in N 6 8 9 10 11 12 13 Year Los Angeles San Diego San Jose 2005 3,000 2,250 2,000 2006 3,750 2,375 2,200 2007 4,000 2,400 2,500 2008 4,500 3,200 3,000 2009 5,000 3,175 3,025 2010 7,500 4,000 4,500 2011 8,750 4,500 5,000 2012 9,000 5,000 5,480 2013 9,000 5,210 6,000 2014 9,200 5,500 6,200 2015 10,000 6,000 6,500 2016 10,250 6,025 7,000 2017 11,750 6,250 7,100 2018 12,250 6,800 7,500 2019 12,500 7,000 7,800 2020 15,000 7,800 8,000 14 15 16 17 18 19 20 21 22 RaceResults Volunteerinfo Participants A1 x 1> B D E F G H 2 Golden State 5k Location Los Angeles 3 20000 4 5 Intercept Slope RSQ Standard Error 5 6 7 8 9 Year 2005 2006 2007 Forecast High Low 2008 10 11 2009 2010 2011 2012 12 13 Participants Donations 3000 $10,000.00 3750 $14,500.00 4000 $17,000.00 4500 $20,000.00 5000 $22,500.00 7500 $30,000.00 8750 $45,000.00 9000 $50,100.00 9000 $56,000.00 9200 $58,250.00 10000 $60,125.00 10250 $62,500.00 11750 $64,000.00 12250 $70,000.00 12500 $75,000.00 15000 $85,500.00 14 2013 15 2014 16 2015 2016 17 18 19 2017 2018 2019 20 21 2020 22 RaceResults Volunteerinfo Participants Exp19_Excel_Ch08_Cap_Golden_State_5K Project Description: You are a volunteer for the Golden State 5k, an annual 5k held across several cities in California to raise money for at risk youth. As part of your duties, you track donations, volunteer information, and race results. This year you have decided to use Excel to calculate frequency distribution by age and time, calculate various descriptive statistics, and forecast participation rate as well as donation rate for 2025. Steps to Perform Step Instructions Points Possible 1 0 2 5 3 5 4 5 5 Start Excel. Download and open the file named Exp19_Excel_Cho8_Cap_Golden State 5k.xlsx. Grader has automatically added your last name to the beginning of the filename. Ensure the RaceResults worksheet is active, then use the FREQUENCY function to calculate the frequency distribution of the race results in column D. Place your results in the range G4:49. Enter a function in cell F22 to calculate the correlation between age (Columns C) and race time (Column D). Enter a function in cell G22 to calculate the covariance between age and race time. Enter a function in cell H22 to calculate the variance of the ages in the data set. Note this is a sample of data not a population. Enter a function in cell 122 to calculate the standard deviation of the ages in the data set. Ensure the Data Analysis ToolPak add-in is active. Use the Data Analysis ToolPak to create a histogram with chart output starting in cell H12 based on the ages of the runners surveyed. Use the range F13:F18 as the Bin Range. Ensure that Chart output and Cumulative percentage is included in the results. Place the upper left hand corner of the chart in cell L13. Ensure the Volunteerinfo worksheet is active. Use the Data Analysis ToolPak to perform a single factor ANOVA on the range C5:E21 (Including column lables). Place the results starting in cell G5. 6 7 7 8 8 9 9 5 Create a Forecast Sheet that depicts year over year growth in participation for the city of Los Angeles. Set the Forecast end year as 2025 and place the results on a new worksheet named 2025Forecast 10 8 Ensure the Participants worksheet is active then create a scatter plot chart that places the Participant observations on the X axis and the Donation dollars on the Y axis (do not include column headings). Add the chart title Participant Forecast and a linear trendline to the chart that also shows the Equation and the R-square. Enter a function in cell F6 to calculate the intercept of the linear trendline created in the prior step. Enter a function in cell G6 to calculate the Slope of the linear trendline. 11 7 12 7 13 Enter a function in cell H6 to calculate the R-square of the linear trendline. 7 14 Enter a function in cell 16 to calculate the Standard Error. 7 15 7 16 8 Use the FORECAST LINEAR function in cell F9 to forecast potential donations once the goal of 20,000 participants is reached. Format the results as Currency. Complete your analysis by adding formulas in the range G9:19 to calculate the high and low thresholds of the forecast. Save and close EXP19_Excel_Ch08_CAP_Golden State5k. Exit Excel. Submit the file as directed 17 0 Total Points 100 A B D E F G H K L M N O P Q R 1 Golden State 5k Time 20 20 Runner # Age 8806 3092 6756 3768 6062 Duration Frequency 0:14:24 2 0:28:48 17 0:43:12 6 21 0:18:43 0:16:34 0:28:48 0:14:24 0:57:36 2 3 4 5 6 7 8 9 10 11 12 13 22 5 0:57:36 1:12:00 22 13 4746 22 1:26:24 2 3503 23 5 8113 23 2913 24 Age Frequency Age 18 25 18 14 8526 9205 1897 27 21 21 Histogram 27 30 30 15 16 Cumulative % 0 0.00% 3 6.00% 12 30.00% 1 32.00% 10 52.00% 12 76.00% 12 100.00% 15 3569 28 40 40 28 50 17 18 50 60 150.00% 100.00% 50.00% 0.00% 29 60 Frequency --Cumulative % 36 >60 More 43 44 0:27:22 0:22:19 0:28:48 0:17:17 0:22:19 0:27:22 0:50:52 0:25:38 0:17:43 0:16:34 0:43:12 0:57:36 1:01:12 0:19:03 1:01:12 1:04:48 0:35:17 1:03:22 0:19:03 1:04:48 1:04:48 0:33:24 More Age Correlation Covariance Variance Standard Deviation 0.5156517 0.152767 266.735 16.33201439 19 20 21 22 23 24 25 26 27 28 29 30 44 7294 3428 3299 4022 2987 9309 5215 8683 4305 5796 6689 4673 8613 9469 46 47 47 47 48 49 49 51 RaceResults Volunteerinfo 2025Forecast Participants + Calculate ED Accessibility: Investigate A1 X A B DE F G . J 1 Duration Frequency 0:14:24 0:28:48 0:43:12 0:57:36 1:12:00 1:26:24 Age 18 21 30 40 50 60 >60 2 3 4 5 6 7 8 9 10 11 12 13 14 15 16 17 18 19 20 21 22 23 24 25 26 27 28 29 30 31 32 33 34 35 36 37 38 Correlation Covariandi Variance Standard Deviation Golden State 5k Runner #Age Time 8806 20 0:18:43 3092 20 0:16:34 6756 21 0:28:48 3768 22 0:14:24 6062 22 0:57:36 4746 22 0:27:22 3503 23 0:22:19 8113 23 0:28:48 2913 24 0:17:17 8526 25 0:22:19 9205 27 0:27:22 1897 27 0:50:52 3569 28 0:25:38 7294 28 0:17:43 3428 29 0:16:34 3299 36 0:43:12 4022 43 0:57:36 2987 44 1:01:12 9309 44 0:19:03 5215 46 1:01:12 8683 47 1:04:48 4305 47 0:35:17 5796 47 1:03:22 6689 48 0:19:03 4673 49 1:04:48 8613 49 1:04:48 9469 51 0:33:24 1936 51 1:04:48 5436 55 1:37:12 4752 55 1:04:48 2398 55 1:04:48 6065 56 0:48:58 4957 57 1:04:48 6971 57 1:37:12 5885 58 1:26:24 2612 58 0:35:17 2617 59 0:48:58 7566 60 1:26:24 6377 61 0:43:12 1569 62 1:04:48 5568 62 1:37:12 2488 63 1:04:48 8206 63 0:14:24 5389 63 0:25:38 6214 66 0:17:17 1895 67 1:37:12 5038 67 1:33:36 5296 67 0:33:24 3463 68 1:04:48 7803 68 0:18:43 41 42 43 44 45 46 47 48 49 50 51 52 53 54 55 RaceResults Volunteerinfo Participants E38 A B C D E F 1 w N Golden State Sk Location Combined 4 in N 6 8 9 10 11 12 13 Year Los Angeles San Diego San Jose 2005 3,000 2,250 2,000 2006 3,750 2,375 2,200 2007 4,000 2,400 2,500 2008 4,500 3,200 3,000 2009 5,000 3,175 3,025 2010 7,500 4,000 4,500 2011 8,750 4,500 5,000 2012 9,000 5,000 5,480 2013 9,000 5,210 6,000 2014 9,200 5,500 6,200 2015 10,000 6,000 6,500 2016 10,250 6,025 7,000 2017 11,750 6,250 7,100 2018 12,250 6,800 7,500 2019 12,500 7,000 7,800 2020 15,000 7,800 8,000 14 15 16 17 18 19 20 21 22 RaceResults Volunteerinfo Participants A1 x 1> B D E F G H 2 Golden State 5k Location Los Angeles 3 20000 4 5 Intercept Slope RSQ Standard Error 5 6 7 8 9 Year 2005 2006 2007 Forecast High Low 2008 10 11 2009 2010 2011 2012 12 13 Participants Donations 3000 $10,000.00 3750 $14,500.00 4000 $17,000.00 4500 $20,000.00 5000 $22,500.00 7500 $30,000.00 8750 $45,000.00 9000 $50,100.00 9000 $56,000.00 9200 $58,250.00 10000 $60,125.00 10250 $62,500.00 11750 $64,000.00 12250 $70,000.00 12500 $75,000.00 15000 $85,500.00 14 2013 15 2014 16 2015 2016 17 18 19 2017 2018 2019 20 21 2020 22 RaceResults Volunteerinfo Participants