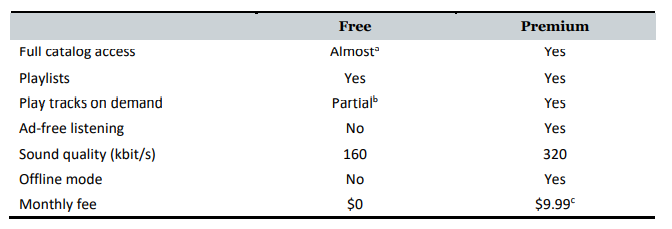
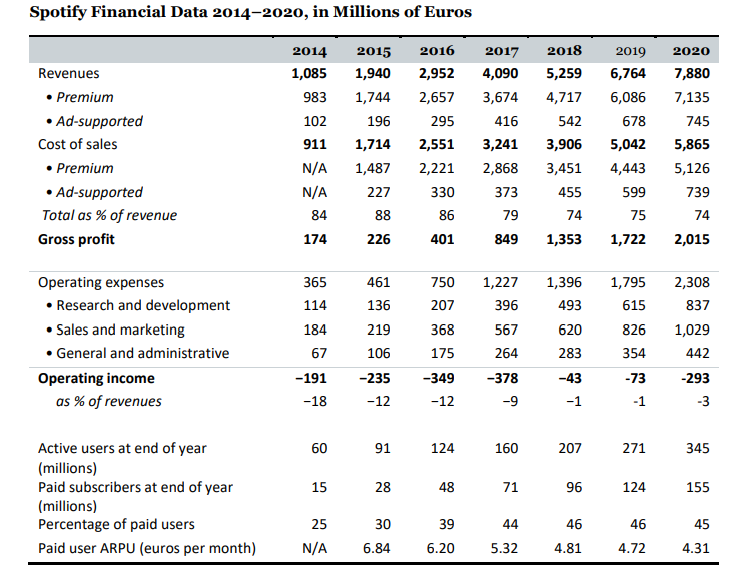
What seems to be more profitable (or have the best chance to become profitable) - free or premium service? What are the differences between free and premium service from an economic (and multi-sided platform) point of view? This requires estimating the profitability of each service using the data


Free Full catalog access Playlists Play tracks on demand Ad-free listening Sound quality (kbit/s) Offline mode Monthly fee Almost Yes Partiait No 160 Premium Yes Yes Yes Yes 320 Yes $9.99 No $0 Spotify Financial Data 2014-2020, in Millions of Euros 2018 2020 Revenues Premium Ad-supported Cost of sales Premium Ad-supported Total as % of revenue Gross profit 2014 1,085 983 102 911 N/A N/A 84 174 2015 1,940 1,744 196 1,714 1,487 227 88 226 2016 2,952 2,657 295 2,551 2,221 330 86 401 2017 4,090 3,674 416 3,241 2,868 373 79 849 5,259 4,717 542 3,906 3,451 455 74 2019 6,764 6,086 678 5,042 4,443 599 75 1,722 7,880 7,135 745 5,865 5,126 739 74 2,015 1,353 Operating expenses Research and development Sales and marketing General and administrative Operating income as % of revenues 365 114 184 67 -191 -18 461 136 219 106 -235 -12 750 207 368 175 -349 -12 1,227 396 567 264 -378 -9 1,396 493 620 283 1,795 615 826 354 2,308 837 1,029 442 -293 -43 -73 -1 -1 -3 60 91 124 160 207 271 345 15 28 48 71 96 124 155 Active users at end of year (millions) Paid subscribers at end of year (millions) Percentage of paid users Paid user ARPU (euros per month) 44 25 N/A 30 6.84 39 6.20 46 4.81 46 4.72 45 4.31 5.32 Free Full catalog access Playlists Play tracks on demand Ad-free listening Sound quality (kbit/s) Offline mode Monthly fee Almost Yes Partiait No 160 Premium Yes Yes Yes Yes 320 Yes $9.99 No $0 Spotify Financial Data 2014-2020, in Millions of Euros 2018 2020 Revenues Premium Ad-supported Cost of sales Premium Ad-supported Total as % of revenue Gross profit 2014 1,085 983 102 911 N/A N/A 84 174 2015 1,940 1,744 196 1,714 1,487 227 88 226 2016 2,952 2,657 295 2,551 2,221 330 86 401 2017 4,090 3,674 416 3,241 2,868 373 79 849 5,259 4,717 542 3,906 3,451 455 74 2019 6,764 6,086 678 5,042 4,443 599 75 1,722 7,880 7,135 745 5,865 5,126 739 74 2,015 1,353 Operating expenses Research and development Sales and marketing General and administrative Operating income as % of revenues 365 114 184 67 -191 -18 461 136 219 106 -235 -12 750 207 368 175 -349 -12 1,227 396 567 264 -378 -9 1,396 493 620 283 1,795 615 826 354 2,308 837 1,029 442 -293 -43 -73 -1 -1 -3 60 91 124 160 207 271 345 15 28 48 71 96 124 155 Active users at end of year (millions) Paid subscribers at end of year (millions) Percentage of paid users Paid user ARPU (euros per month) 44 25 N/A 30 6.84 39 6.20 46 4.81 46 4.72 45 4.31 5.32


