

Answered step by step
Verified Expert Solution
Question
1 Approved Answer
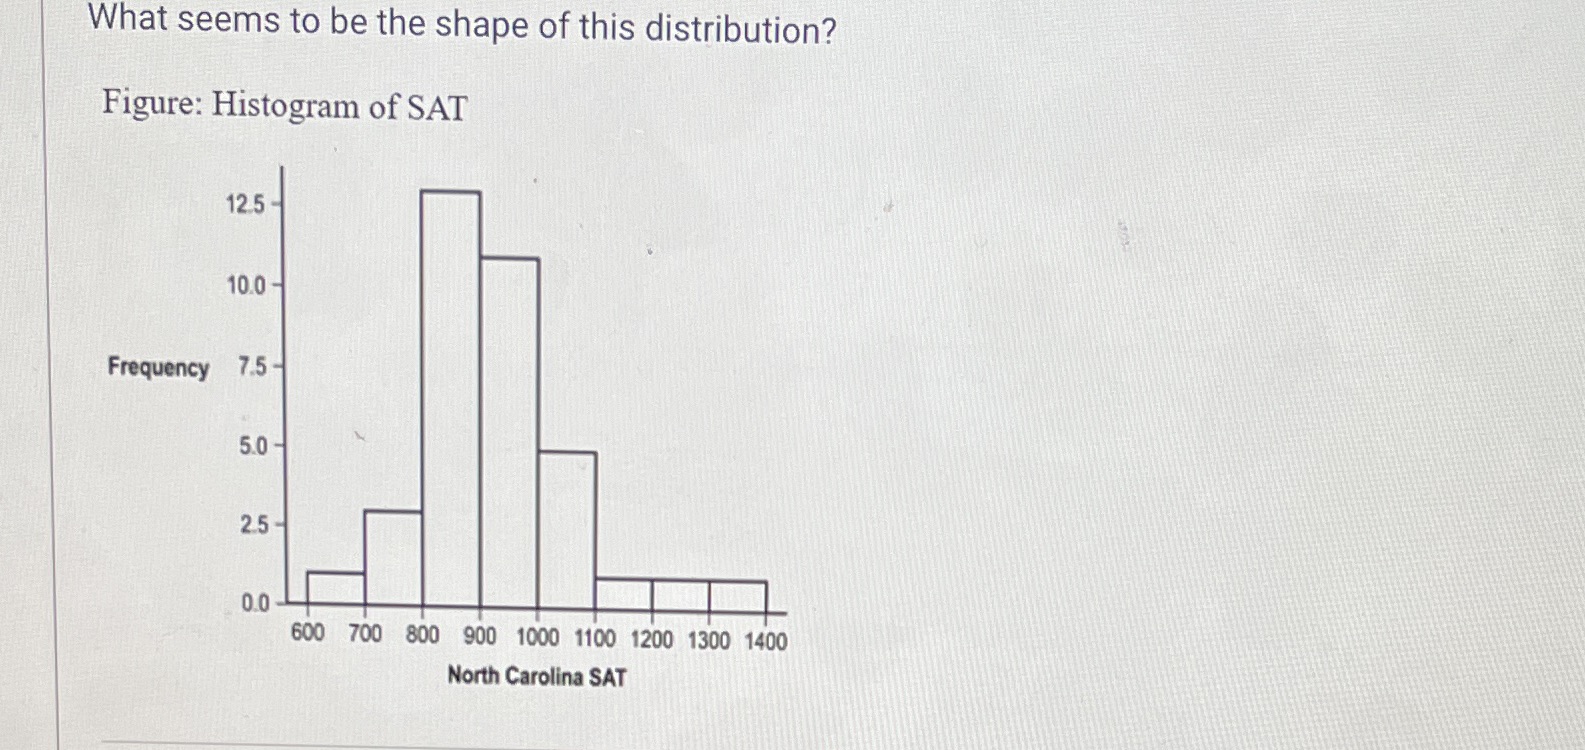
What seems to be the shape of this distribution? Figure: Histogram of SAT 125 10.0 - Frequency 7.5- 5.0 - 25- 0.0 600 700 800

Step by Step Solution
There are 3 Steps involved in it
Step: 1

Get Instant Access to Expert-Tailored Solutions
See step-by-step solutions with expert insights and AI powered tools for academic success
Step: 2

Step: 3
Ace Your Homework with AI
Get the answers you need in no time with our AI-driven, step-by-step assistance
Get Started
Analysis for Financial Management
Authors: Robert C. Higgins
12th edition
1259918963, 9781260140729 , 978-1259918964