Answered step by step
Verified Expert Solution
Question
1 Approved Answer
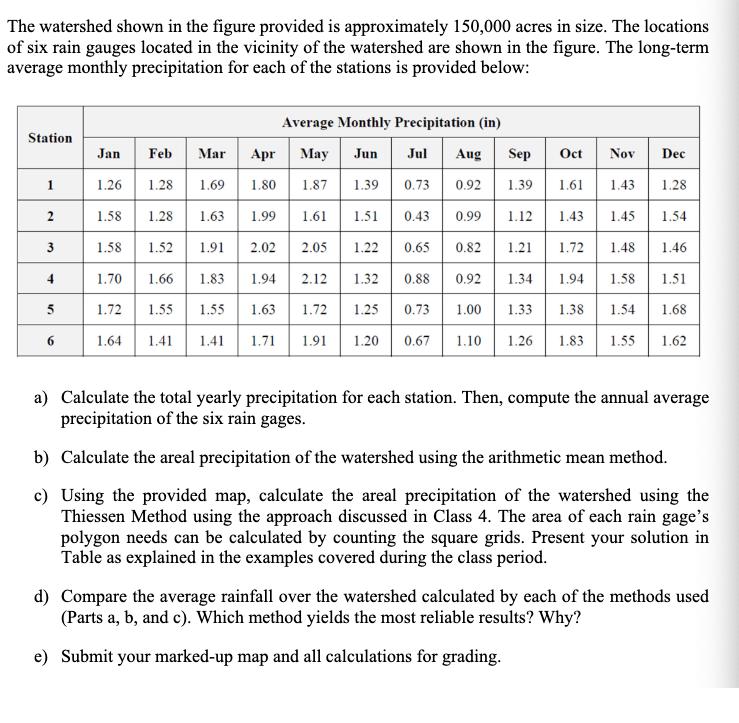
The watershed shown in the figure provided is approximately 150,000 acres in size. The locations of six rain gauges located in the vicinity of


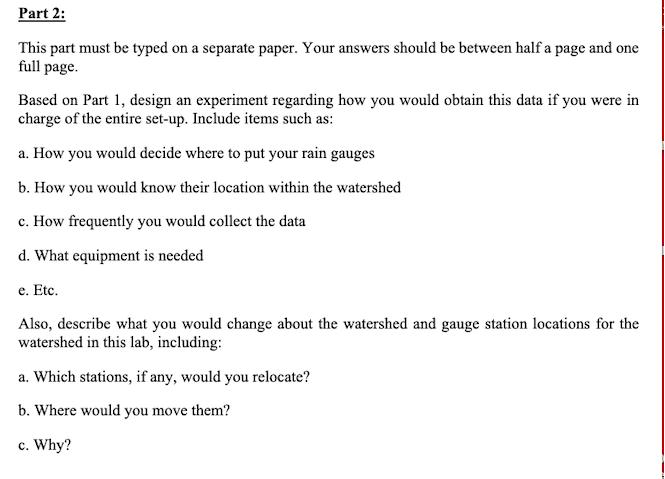
The watershed shown in the figure provided is approximately 150,000 acres in size. The locations of six rain gauges located in the vicinity of the watershed are shown in the figure. The long-term average monthly precipitation for each of the stations is provided below: Average Monthly Precipitation (in) Station Jan Feb Mar Apr May Jun Jul Aug Sep Oct Nov Dec 1 1.26 1.28 1.69 1.80 1.87 1.39 0.73 0.92 1.39 1.61 1.43 1.28 2 1.58 1.28 1.63 1.99 1.61 1.51 0.43 0.99 1.12 1.43 1.45 1.54 3 1.58 1.52 1.91 2.02 2.05 1.22 0.65 0.82 1.21 1.72 1.48 1.46 4 1.70 1.66 1.83 1.94 2.12 1.32 0.88 0.92 1.34 1.94 1.58 1.51 5 1.72 1.55 1.55 1.63 1.72 1.25 0.73 1.00 1.33 1.38 1.54 1.68 6 1.64 1.41 1.41 1.71 1.91 1.20 0.67 1.10 1.26 1.83 1.55 1.62 a) Calculate the total yearly precipitation for each station. Then, compute the annual average precipitation of the six rain gages. b) Calculate the areal precipitation of the watershed using the arithmetic mean method. c) Using the provided map, calculate the areal precipitation of the watershed using the Thiessen Method using the approach discussed in Class 4. The area of each rain gage's polygon needs can be calculated by counting the square grids. Present your solution in Table as explained in the examples covered during the class period. d) Compare the average rainfall over the watershed calculated by each of the methods used (Parts a, b, and c). Which method yields the most reliable results? Why? e) Submit your marked-up map and all calculations for grading. Part 2: This part must be typed on a separate paper. Your answers should be between half a page and one full page. Based on Part 1, design an experiment regarding how you would obtain this data if you were in charge of the entire set-up. Include items such as: a. How you would decide where to put your rain gauges b. How you would know their location within the watershed c. How frequently you would collect the data d. What equipment is needed e. Etc. Also, describe what you would change about the watershed and gauge station locations for the watershed in this lab, including: a. Which stations, if any, would you relocate? b. Where would you move them? c. Why?
Step by Step Solution
★★★★★
3.49 Rating (156 Votes )
There are 3 Steps involved in it
Step: 1
Section 1 a We add up the monthly precipitation values for every station to determine the total yearly precipitation for each station Next we compute the average yearly precipitation for each of the s...
Get Instant Access to Expert-Tailored Solutions
See step-by-step solutions with expert insights and AI powered tools for academic success
Step: 2

Step: 3

Ace Your Homework with AI
Get the answers you need in no time with our AI-driven, step-by-step assistance
Get Started


