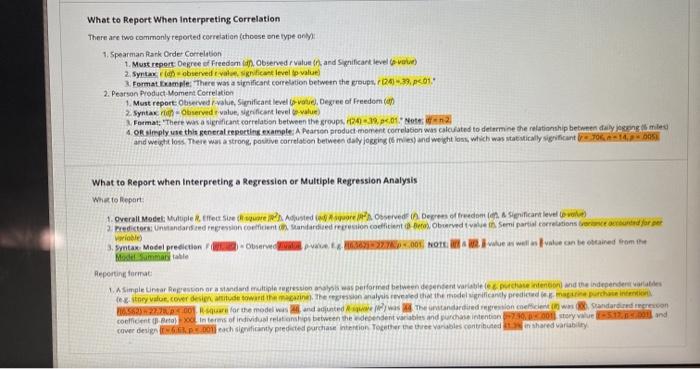
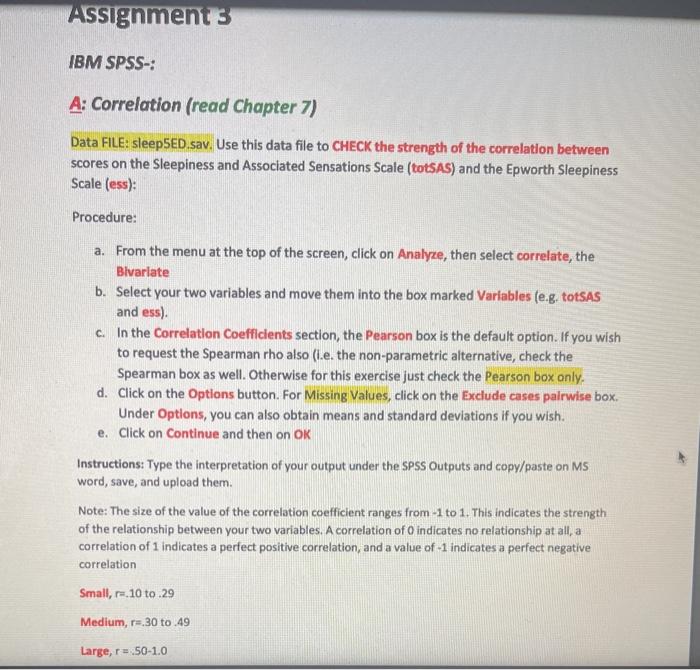
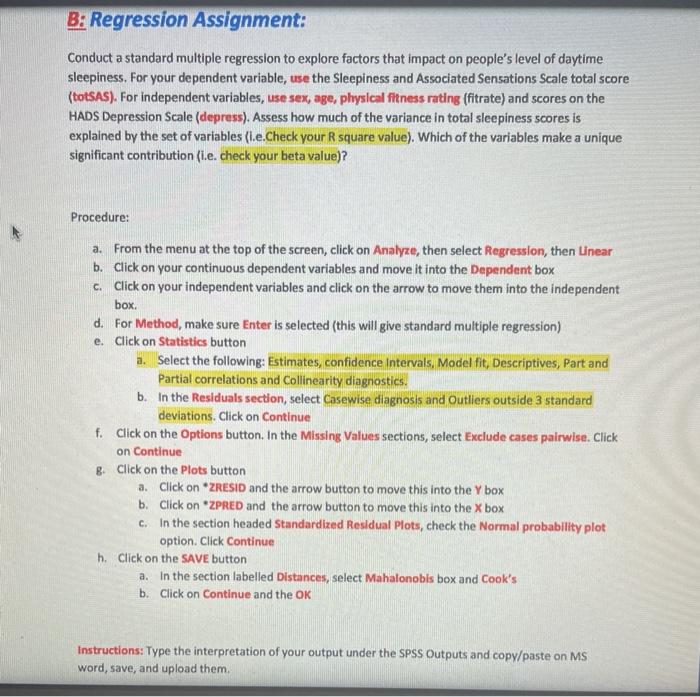
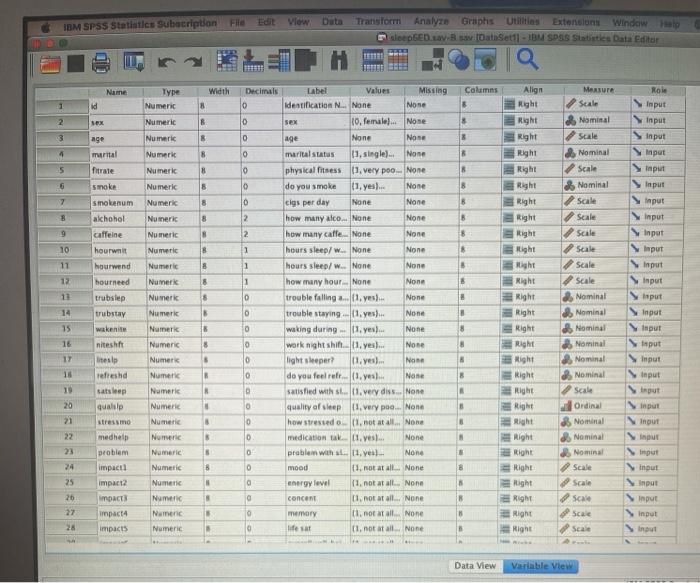
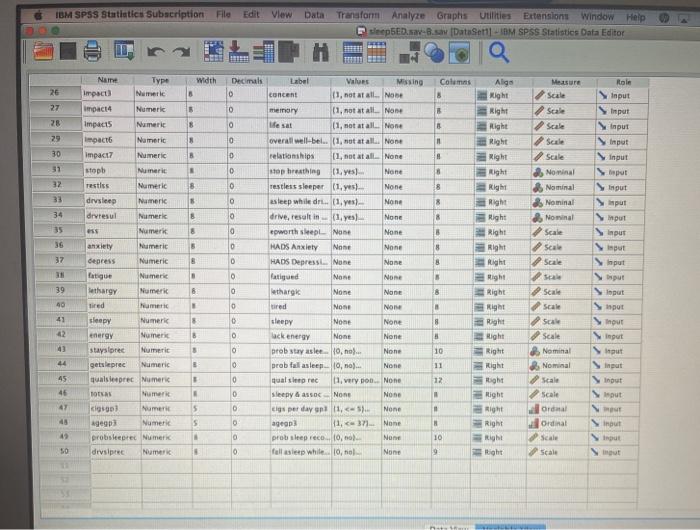
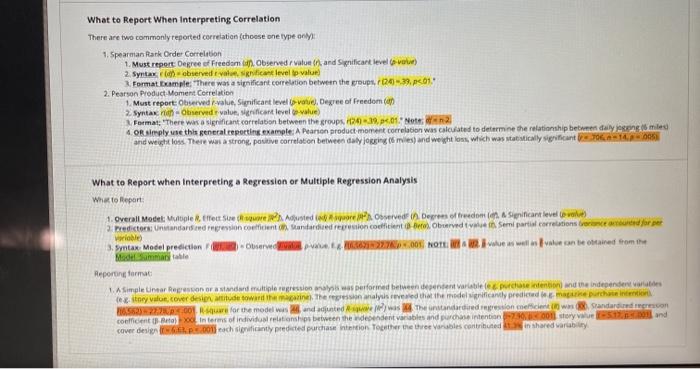
What to Report When Interpreting Correlation There are two commonly reported correlation (choose one typen 1. Spearman Rark Order Correlation 1. Must report Degree of Freedom. Observed value () and Significant level (W) 2 Syntax observed valorificant levelt value Format Example: There was a significant correlation between the groups. 0241-3301 2. Pearson Product Moment Correlation 1. Must report Observed value. Significant level toe.Degree of Freedoman Syntax Observed valur, rificant level te value) Format: 'There was a significant correlation between the groups. 439.01. Note 2 4 or simply this general reporting example: A Pearson product moment correlation was calculated to determine the relationship between delen med and weight loss. There was a strong positive correlation between day jong mand weight loss which was statistically significant What to Report when interpreting a Regression or multiple Regression Analysis What Report 1. Overall Mode Multiple tirect Suede Adjusted conserver Degrees of freedom na Snificant level 2. Predictors Una cand pression coefficient Standard roncodficiente. Obrved as Semipartial correlations concorded for variable 3.Syntax Model prediction obrve. Note: well as he can be obtained from the Model Summary table Reporting format 1. A Simple Linear Regression or add multiple regression was performed between depenent variable le pude cond the independent artes ex story valor, cover desude toward them. The press analysis revealed that the model canily predictement Os for the models and adjusted as the standardie gesonceices Standardized recon coefficient to in terms of individual relations between the decentrables and purchase intention 2000 story and Cover design ..ach secantly predicted purchase on Together the tree variables contributed in shared variability Assignments IBM SPSS-: A: Correlation (read Chapter 7) Data FILE: sleepSED.sav. Use this data file to CHECK the strength of the correlation between scores on the Sleepiness and Associated Sensations Scale (totSAS) and the Epworth Sleepiness Scale (ess): Procedure: a. From the menu at the top of the screen, click on Analyze, then select correlate, the Blvarlate b. Select your two variables and move them into the box marked Variables (eg, totSAS and ess). c. In the Correlation coefficients section, the Pearson box is the default option. If you wish to request the Spearman rho also (l.e. the non-parametric alternative, check the Spearman box as well. Otherwise for this exercise just check the Pearson box only, d. Click on the Options button. For Missing Values, click on the Exclude cases pairwise box. Under Options, you can also obtain means and standard deviations if you wish. e. Click on Continue and then on OK Instructions: Type the interpretation of your output under the SPSS Outputs and copy/paste on MS word, save, and upload them. Note: The size of the value of the correlation coefficient ranges from-1 to 1. This indicates the strength of the relationship between your two variables. A correlation of O indicates no relationship at all, a correlation of 1 indicates a perfect positive correlation, and a value of -1 indicates a perfect negative correlation Small, r.10 to 29 Medium, r=-30 to 49 Large, r= 50-1.0 B: Regression Assignment: Conduct a standard multiple regression to explore factors that impact on people's level of daytime sleepiness. For your dependent variable, use the Sleepiness and Associated Sensations Scale total score (totSAS). For independent variables, use sex, age, physical fitness rating (fitrate) and scores on the HADS Depression Scale (depress). Assess how much of the variance in total sleepiness scores is explained by the set of variables (.e.Check your square value). Which of the variables make a unique significant contribution (i.e. check your beta value)? Procedure: a. From the menu at the top of the screen, click on Analyze, then select Regression, then Linear b. Click on your continuous dependent variables and move it into the Dependent box C. Click on your independent variables and click on the arrow to move them into the independent box. d. For Method, make sure Enter is selected (this will give standard multiple regression) e. Click on Statistics button a. Select the following: Estimates, confidence intervals, Model fit, Descriptives, Part and Partial correlations and Collinearity diagnostics. b. In the Residuals section, select Casewise diagnosis and Outliers outside 3 standard deviations. Click on Continue f. Click on the Options button. In the Missing Values sections, select Exclude cases pairwise. Click on Continue 8. Click on the Plots button a. Click on ZRESID and the arrow button to move this into the Y box b. Click on *ZPRED and the arrow button to move this into the Xbox c. In the section headed Standardized Residual Plots, check the Normal probability plot option. Click Continue h. Click on the SAVE button a. In the section labelled Distances, select Mahalonobis box and Cook's b. Click on Continue and the OK Instructions: Type the interpretation of your output under the SPSS Outputs and copy/paste on MS word, save, and upload them. IBM SPSS Statistics Subscription File Edit View Duta Transform Analyze Graphs Utilities Extension Windows lepED.sav. saataSet11 - BM SPSS States Data Editor Q Name Width 8 Messure scale id 2. SEX B Type Numeric Numeric Numeric Numeri Numeric 3 age 8 4 8 marial fitrate 5 8 6 8 Numeric Numeri 7 8 8 8 9 8 10 B Role Input input Input put Sinput pur Input Input Input Input Input Input Input Input Input Input Input 8 11 12 11 8 Numeric Numeric Numeri Numeri Numerk Numerk Numeri Numerk Numeric Numeri Numer 8 14 8 Decimal Label Values Missing 0 Identification N... None Nose D sex 10. female). None 0 age None None 0 marital status 11 single). None 0 physical fitsess 11. very poo. None do you smoke 11. yes)... None D cigs per day None None 2 how many alco... None None 2 how many caffe. None None 1 hours sleep/ w None None 1 hours sleep/ w.. None None 1 how many hour... None None 0 trouble falling ... 11. yes). None 0 trouble staying. 11.yes)... None 0 waking during 13.yes) None 0 work night shift.01. yes... Nose 0 light sleeper? 11. yes). None 0 do you feel ref...yeah... None 0 satisfied with st. 1. very diss... None 0 quality of sleep 11, very po... None 0 how stressed or not at all. None 0 medication takes None 0 prable with st. 11. yes None 0 mood 11. not at all. None energy level (1. not at all. None a concent 11. not at all None 0 memory 11. not at all None 0 lifest 11. not at all. None smoke Smolenum alchohol caffeine hour hourwend hourneed trubstep trubstay wakene niteshift litesi refreshd step qualitp Stressmo medhelp problem impact impacta mpact impacta impacts Columns Align Right Right 8 Right Right B Right 8 Right Right B Right 8 Right 8 Right 8 Right 8 Right Right Right 8 Right 8 Right Right 8 Right Right 8 Right Right Right Right Right Right Right Right Right 15 Nominal Scale Nominal Scale Nominal Scale Scale Scale scale Scale Scale Nominal Nominal Nominal Nominal Nominal Nominal Scale Ordinal Nominal Nominal Nominal Scale Scale Scale Scale Scale 16 8 16 20 nut thout 21 8 23 ut 24 Numerie Numerie Numeri Numere Numeri Numeric Numer Numer Namen Numerie 8 25 input 26 Input Input 27 Data View Variable View IBM SPSS Statistics Subscription File Edit View Data Transform Analyze Graphis Utilities Extension Window Help sleepED.-8.aw DataSet 11-IM SPSS Statistics Data Editor D Q Name Width Columns Role 26 B 27 5 B 28 8 esat 8 Input Input Input Input 8 29 30 8 . 8 31 32 Alge Right Right Right Right Right Right Right Right Right Right Right Right Measure Scale Scale Scale Scale Scale Nominal Nominal Nominal Nominal Scale Scale Scale 8 gut 33 8 S THE 8 34 8 8 put 35 8 8 36 put out 8 37 8 Type Impact) Netice impact Numeric impacts Numeric Impacto Numeric impact Numeric stoph Numeri Testis Numeric drvsleep Numeric drvresul Numeri ess Numerk anxiety Numeri depress Numeric fatigue Numeri lethargy Numeri tired Numer sleepy Numeric energy Numeri stayspred Nurmeric getsleprec Numeric qualsierec Numeri Numeri cigo Numer agep Numeric probis erec Numerk despre Numeri Decimal Label Values Missing 0 content 11, not at all. No 0 memory 11. not at all None 0 (1, not at all. None 0 overall well-bei.. (1, not at all. None 0 relationships 11. not at all. None 0 stop breathing 11 None 0 restless sleeper (1,7) None 0 asteep while dr... (1.yes) None 0 drive, result in (1. yes) None epworth spl None None 0 MADS Anxiety None None 0 HADS Depresst. None None 0 None None 0 etharga None None 0 tired None sleepy None None 0 None None 0 prob stay aslee 10, no... None 0 prabfall asleep. 10,0) None 0 qualseprec 11, very pon. None 0 Sleepy & assoc None None D cigs per day at 11,5 None O agen 11.37. None 0 prob sleep rece... 10, no None 0 fall asleep while. 10, None put 3 B 39 8 8 40 NO 41 8 8 Scale Scale Scale Scale Nominal Nominal Sot out gut 42 cenergy 8 3 10 EMMEL Input 24 11 Right Right Right Right Right Right Right Right Right Right Right light 45 12 nout 46 E 47 . 5 $ Scale Scale Ordal Ordinal Scale Scale nout 42 10 . 9 What to Report When Interpreting Correlation There are two commonly reported correlation (choose one type only 1. Spearman Rank Order Correlation 1. Must report Degree of Freedom. Observed value(/), and Sificant level (W) 2 Syntax observed value can level ip value Format Example. There was a significant correlation between the groups. 024-3301 2. Pearson Product Moment Correlation 1. Must report Observed value. Significant level of Degree of freedom 2. Syntax in Observed valur, ficant level to value) Format: "There was a significant correlation between the groups. 024-394.01. Note 2 4 or simply this general reporting example: A Pearson product moment correlation was calculated to determine the relationship betime dalyjen med and weight loss. There was a strong pouve correlation between day jong miles and weht loss, which was statistically significant What to Report when interpreting a Regression or multiple Regression Analysis What to Report 1. Overall Mode Multiple tirect Suede Adjusted Over Degrees of freedom Significant level wat 2 Predictors naar de son coefficient Standard recreion codicente. Obroved to Semipartial correlations conded for pe Worlable 3.Syntax Model prediction Obr. NOTE: will be on the obtained from the Moderate Reporting format A Simple Linear Regression or a dard multiple regression was performed between depenent variable de presidentin and the independentes te the value, cover design de toward that there analysis revealed that the model ignificantly predicted machine 2. for the models and adjusted was the dired ingression meficient in wes Standardized icon coefficient to in terms of individual relationship between the wendentables and purchase intention story and coverdele .001ach scantly predicted purchase in Tout the three able contributed in shared variability What to Report When Interpreting Correlation There are two commonly reported correlation (choose one typen 1. Spearman Rark Order Correlation 1. Must report Degree of Freedom. Observed value () and Significant level (W) 2 Syntax observed valorificant levelt value Format Example: There was a significant correlation between the groups. 0241-3301 2. Pearson Product Moment Correlation 1. Must report Observed value. Significant level toe.Degree of Freedoman Syntax Observed valur, rificant level te value) Format: 'There was a significant correlation between the groups. 439.01. Note 2 4 or simply this general reporting example: A Pearson product moment correlation was calculated to determine the relationship between delen med and weight loss. There was a strong positive correlation between day jong mand weight loss which was statistically significant What to Report when interpreting a Regression or multiple Regression Analysis What Report 1. Overall Mode Multiple tirect Suede Adjusted conserver Degrees of freedom na Snificant level 2. Predictors Una cand pression coefficient Standard roncodficiente. Obrved as Semipartial correlations concorded for variable 3.Syntax Model prediction obrve. Note: well as he can be obtained from the Model Summary table Reporting format 1. A Simple Linear Regression or add multiple regression was performed between depenent variable le pude cond the independent artes ex story valor, cover desude toward them. The press analysis revealed that the model canily predictement Os for the models and adjusted as the standardie gesonceices Standardized recon coefficient to in terms of individual relations between the decentrables and purchase intention 2000 story and Cover design ..ach secantly predicted purchase on Together the tree variables contributed in shared variability Assignments IBM SPSS-: A: Correlation (read Chapter 7) Data FILE: sleepSED.sav. Use this data file to CHECK the strength of the correlation between scores on the Sleepiness and Associated Sensations Scale (totSAS) and the Epworth Sleepiness Scale (ess): Procedure: a. From the menu at the top of the screen, click on Analyze, then select correlate, the Blvarlate b. Select your two variables and move them into the box marked Variables (eg, totSAS and ess). c. In the Correlation coefficients section, the Pearson box is the default option. If you wish to request the Spearman rho also (l.e. the non-parametric alternative, check the Spearman box as well. Otherwise for this exercise just check the Pearson box only, d. Click on the Options button. For Missing Values, click on the Exclude cases pairwise box. Under Options, you can also obtain means and standard deviations if you wish. e. Click on Continue and then on OK Instructions: Type the interpretation of your output under the SPSS Outputs and copy/paste on MS word, save, and upload them. Note: The size of the value of the correlation coefficient ranges from-1 to 1. This indicates the strength of the relationship between your two variables. A correlation of O indicates no relationship at all, a correlation of 1 indicates a perfect positive correlation, and a value of -1 indicates a perfect negative correlation Small, r.10 to 29 Medium, r=-30 to 49 Large, r= 50-1.0 B: Regression Assignment: Conduct a standard multiple regression to explore factors that impact on people's level of daytime sleepiness. For your dependent variable, use the Sleepiness and Associated Sensations Scale total score (totSAS). For independent variables, use sex, age, physical fitness rating (fitrate) and scores on the HADS Depression Scale (depress). Assess how much of the variance in total sleepiness scores is explained by the set of variables (.e.Check your square value). Which of the variables make a unique significant contribution (i.e. check your beta value)? Procedure: a. From the menu at the top of the screen, click on Analyze, then select Regression, then Linear b. Click on your continuous dependent variables and move it into the Dependent box C. Click on your independent variables and click on the arrow to move them into the independent box. d. For Method, make sure Enter is selected (this will give standard multiple regression) e. Click on Statistics button a. Select the following: Estimates, confidence intervals, Model fit, Descriptives, Part and Partial correlations and Collinearity diagnostics. b. In the Residuals section, select Casewise diagnosis and Outliers outside 3 standard deviations. Click on Continue f. Click on the Options button. In the Missing Values sections, select Exclude cases pairwise. Click on Continue 8. Click on the Plots button a. Click on ZRESID and the arrow button to move this into the Y box b. Click on *ZPRED and the arrow button to move this into the Xbox c. In the section headed Standardized Residual Plots, check the Normal probability plot option. Click Continue h. Click on the SAVE button a. In the section labelled Distances, select Mahalonobis box and Cook's b. Click on Continue and the OK Instructions: Type the interpretation of your output under the SPSS Outputs and copy/paste on MS word, save, and upload them. IBM SPSS Statistics Subscription File Edit View Duta Transform Analyze Graphs Utilities Extension Windows lepED.sav. saataSet11 - BM SPSS States Data Editor Q Name Width 8 Messure scale id 2. SEX B Type Numeric Numeric Numeric Numeri Numeric 3 age 8 4 8 marial fitrate 5 8 6 8 Numeric Numeri 7 8 8 8 9 8 10 B Role Input input Input put Sinput pur Input Input Input Input Input Input Input Input Input Input Input 8 11 12 11 8 Numeric Numeric Numeri Numeri Numerk Numerk Numeri Numerk Numeric Numeri Numer 8 14 8 Decimal Label Values Missing 0 Identification N... None Nose D sex 10. female). None 0 age None None 0 marital status 11 single). None 0 physical fitsess 11. very poo. None do you smoke 11. yes)... None D cigs per day None None 2 how many alco... None None 2 how many caffe. None None 1 hours sleep/ w None None 1 hours sleep/ w.. None None 1 how many hour... None None 0 trouble falling ... 11. yes). None 0 trouble staying. 11.yes)... None 0 waking during 13.yes) None 0 work night shift.01. yes... Nose 0 light sleeper? 11. yes). None 0 do you feel ref...yeah... None 0 satisfied with st. 1. very diss... None 0 quality of sleep 11, very po... None 0 how stressed or not at all. None 0 medication takes None 0 prable with st. 11. yes None 0 mood 11. not at all. None energy level (1. not at all. None a concent 11. not at all None 0 memory 11. not at all None 0 lifest 11. not at all. None smoke Smolenum alchohol caffeine hour hourwend hourneed trubstep trubstay wakene niteshift litesi refreshd step qualitp Stressmo medhelp problem impact impacta mpact impacta impacts Columns Align Right Right 8 Right Right B Right 8 Right Right B Right 8 Right 8 Right 8 Right 8 Right Right Right 8 Right 8 Right Right 8 Right Right 8 Right Right Right Right Right Right Right Right Right 15 Nominal Scale Nominal Scale Nominal Scale Scale Scale scale Scale Scale Nominal Nominal Nominal Nominal Nominal Nominal Scale Ordinal Nominal Nominal Nominal Scale Scale Scale Scale Scale 16 8 16 20 nut thout 21 8 23 ut 24 Numerie Numerie Numeri Numere Numeri Numeric Numer Numer Namen Numerie 8 25 input 26 Input Input 27 Data View Variable View IBM SPSS Statistics Subscription File Edit View Data Transform Analyze Graphis Utilities Extension Window Help sleepED.-8.aw DataSet 11-IM SPSS Statistics Data Editor D Q Name Width Columns Role 26 B 27 5 B 28 8 esat 8 Input Input Input Input 8 29 30 8 . 8 31 32 Alge Right Right Right Right Right Right Right Right Right Right Right Right Measure Scale Scale Scale Scale Scale Nominal Nominal Nominal Nominal Scale Scale Scale 8 gut 33 8 S THE 8 34 8 8 put 35 8 8 36 put out 8 37 8 Type Impact) Netice impact Numeric impacts Numeric Impacto Numeric impact Numeric stoph Numeri Testis Numeric drvsleep Numeric drvresul Numeri ess Numerk anxiety Numeri depress Numeric fatigue Numeri lethargy Numeri tired Numer sleepy Numeric energy Numeri stayspred Nurmeric getsleprec Numeric qualsierec Numeri Numeri cigo Numer agep Numeric probis erec Numerk despre Numeri Decimal Label Values Missing 0 content 11, not at all. No 0 memory 11. not at all None 0 (1, not at all. None 0 overall well-bei.. (1, not at all. None 0 relationships 11. not at all. None 0 stop breathing 11 None 0 restless sleeper (1,7) None 0 asteep while dr... (1.yes) None 0 drive, result in (1. yes) None epworth spl None None 0 MADS Anxiety None None 0 HADS Depresst. None None 0 None None 0 etharga None None 0 tired None sleepy None None 0 None None 0 prob stay aslee 10, no... None 0 prabfall asleep. 10,0) None 0 qualseprec 11, very pon. None 0 Sleepy & assoc None None D cigs per day at 11,5 None O agen 11.37. None 0 prob sleep rece... 10, no None 0 fall asleep while. 10, None put 3 B 39 8 8 40 NO 41 8 8 Scale Scale Scale Scale Nominal Nominal Sot out gut 42 cenergy 8 3 10 EMMEL Input 24 11 Right Right Right Right Right Right Right Right Right Right Right light 45 12 nout 46 E 47 . 5 $ Scale Scale Ordal Ordinal Scale Scale nout 42 10 . 9 What to Report When Interpreting Correlation There are two commonly reported correlation (choose one type only 1. Spearman Rank Order Correlation 1. Must report Degree of Freedom. Observed value(/), and Sificant level (W) 2 Syntax observed value can level ip value Format Example. There was a significant correlation between the groups. 024-3301 2. Pearson Product Moment Correlation 1. Must report Observed value. Significant level of Degree of freedom 2. Syntax in Observed valur, ficant level to value) Format: "There was a significant correlation between the groups. 024-394.01. Note 2 4 or simply this general reporting example: A Pearson product moment correlation was calculated to determine the relationship betime dalyjen med and weight loss. There was a strong pouve correlation between day jong miles and weht loss, which was statistically significant What to Report when interpreting a Regression or multiple Regression Analysis What to Report 1. Overall Mode Multiple tirect Suede Adjusted Over Degrees of freedom Significant level wat 2 Predictors naar de son coefficient Standard recreion codicente. Obroved to Semipartial correlations conded for pe Worlable 3.Syntax Model prediction Obr. NOTE: will be on the obtained from the Moderate Reporting format A Simple Linear Regression or a dard multiple regression was performed between depenent variable de presidentin and the independentes te the value, cover design de toward that there analysis revealed that the model ignificantly predicted machine 2. for the models and adjusted was the dired ingression meficient in wes Standardized icon coefficient to in terms of individual relationship between the wendentables and purchase intention story and coverdele .001ach scantly predicted purchase in Tout the three able contributed in shared variability
