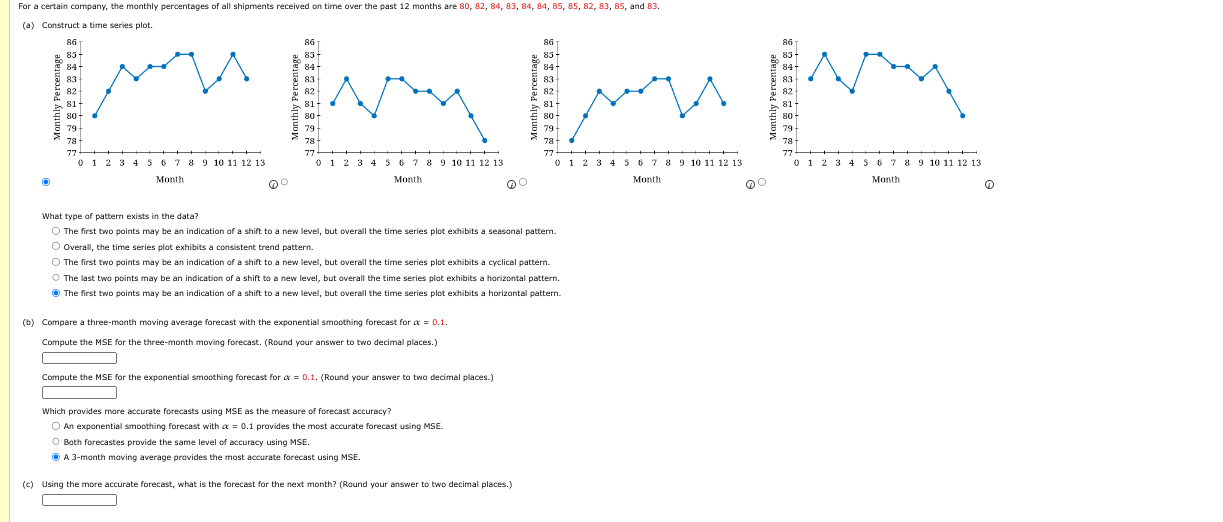
What type of pattem exists in the data? The first two points may be an indication of a shift to a new level, but overall the time series plot exhibits a seasonal pattem. Overall, the time series plat exhibits a consistent trend pattern. The first two points may be an indication of a shift to a new level, but overall the time series plot exhibits a cyclical pattern. The last two points may be an indication of a shift to a new level, but overall the time series plot exhibits a horizontal pattern. The first two points may be an indication of a shift to a new level, but overall the time series plot exhibits a horizontal pattern. (b) Compare a three-month moving average forecast with the exponential smoothing forecast for =0.1. Compute the MSE for the three-month moving forecast. (Round your answer to two decimal places.) Compute the MSE for the exponential smoothing forecast for =0.1. (Round your answer to two decimal places.) Which provides more accurate forecasts using MSE as the measure of forecast accuracy? An exponential smoothing forecast with =0.1 provides the most accurate forecast using MSE. Bath forecastes provide the same level of accuracy using MSE. A 3-month moving average provides the most accurate forecast using MSE. (c) Using the more accurate forecast, what is the forecast for the next month? (Round your answer to two decimal places.) What type of pattem exists in the data? The first two points may be an indication of a shift to a new level, but overall the time series plot exhibits a seasonal pattem. Overall, the time series plat exhibits a consistent trend pattern. The first two points may be an indication of a shift to a new level, but overall the time series plot exhibits a cyclical pattern. The last two points may be an indication of a shift to a new level, but overall the time series plot exhibits a horizontal pattern. The first two points may be an indication of a shift to a new level, but overall the time series plot exhibits a horizontal pattern. (b) Compare a three-month moving average forecast with the exponential smoothing forecast for =0.1. Compute the MSE for the three-month moving forecast. (Round your answer to two decimal places.) Compute the MSE for the exponential smoothing forecast for =0.1. (Round your answer to two decimal places.) Which provides more accurate forecasts using MSE as the measure of forecast accuracy? An exponential smoothing forecast with =0.1 provides the most accurate forecast using MSE. Bath forecastes provide the same level of accuracy using MSE. A 3-month moving average provides the most accurate forecast using MSE. (c) Using the more accurate forecast, what is the forecast for the next month? (Round your answer to two decimal places.)


