

Answered step by step
Verified Expert Solution
Question
1 Approved Answer
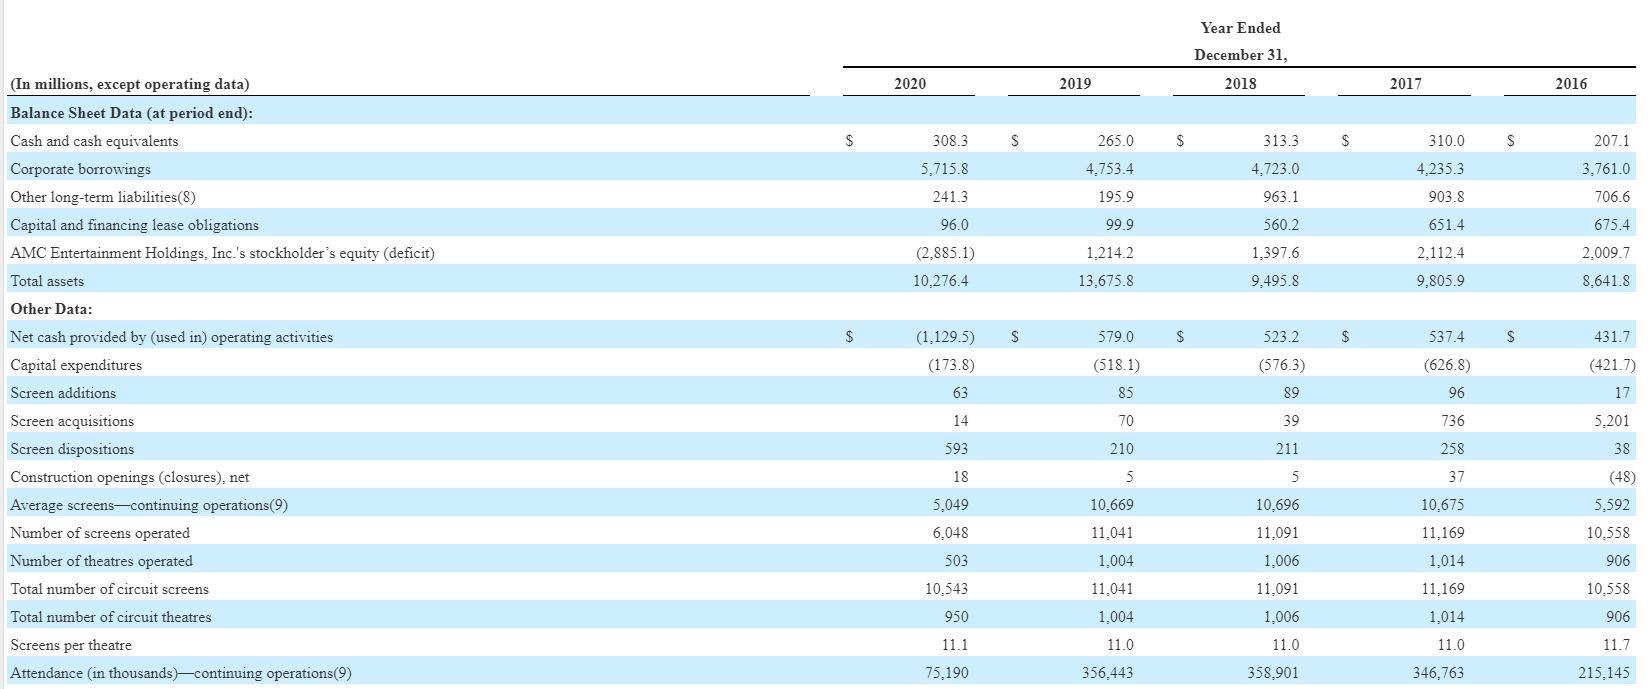
What was AMCs debt ratio on December 31, 2020, compared to December 31, 2019? Did the debt ratio improve or decline for AMC during 2020?
- What was AMCs debt ratio on December 31, 2020, compared to December 31, 2019? Did the debt ratio improve or decline for AMC during 2020? Please show the basis of your calculation of the debt ratios and summerize the challenges that AMC faced during 2020 that led to the change in AMCs debt ratio you calculated.
Step by Step Solution
There are 3 Steps involved in it
Step: 1

Get Instant Access to Expert-Tailored Solutions
See step-by-step solutions with expert insights and AI powered tools for academic success
Step: 2

Step: 3
Ace Your Homework with AI
Get the answers you need in no time with our AI-driven, step-by-step assistance
Get Started
Contemporary Conflict Resolution
Authors: Oliver Ramsbotham, Tom Woodhouse, Hugh Miall
3rd Edition
0745649742,1509509542