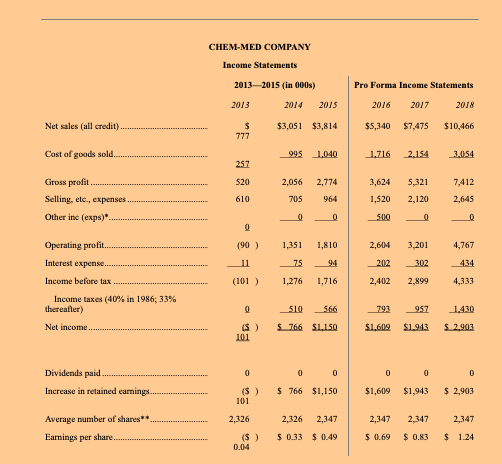
- What was Chem-Meds rate of sales growth in 2015? What is it forecasted to be in 2016, 2017, and 2018?
- What was Chem-Meds net income growth in 2015? What is it forecasted to be in 2016, 2017, and 2018? Is projected net income growing faster or slower than projected sales? After computing these values, take a hard look at the 2016 income statement data to see if you want to make any adjustments.
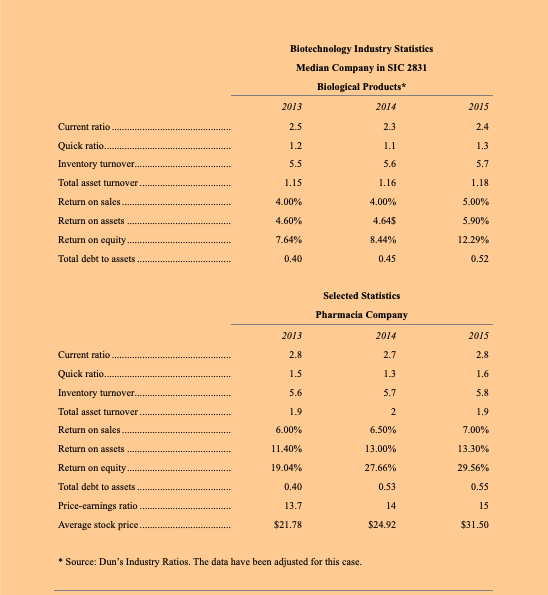
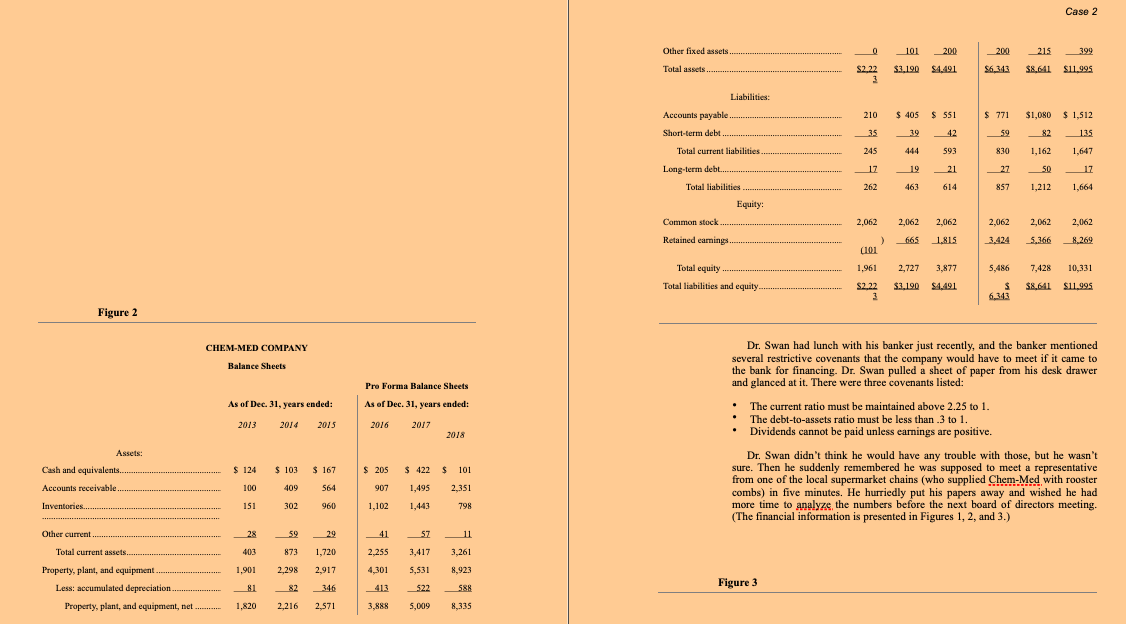
- How does Chem-Meds current ratio for 2015 compare to Pharmacias? How does it compare to the industry average? Compute Chem-Meds current ratio for 2018. Is there any problem with it?
Biotechnology Industry Statistics Median Company in SIC 2831 Biological Products 2013 2014 2015 Current ratio 2.5 2.3 2.4 1.2 1.1 Quick ratio. Inventory turnover. Total asset turnover 1.3 5.7 5.5 5.6 1.15 1.16 1.18 Return on sales 5.00% 4.00% 4.60% 4.00% 4.645 Return on assets Return on equity. Total debt to assets 5.90% 12.29% 7.64% 8.44% 0.45 0.40 0.52 Selected Statistics Pharmacia Company 2014 2013 2015 2.8 2.7 2.8 1.5 1.3 1.6 Current ratio Quick ratio Inventory turnover.. Total asset turnover Return on sales 5.6 5.7 5.8 1.9 2 1.9 6.00% 7.00% Return on assets 11.40% 6.50% 13.00% 27.66% 13.30% 19.04% 29.56% 0.55 0.40 0.53 Return on equity Total debt to assets. Price-camings ratio Average stock price. 13.7 14 15 $21.78 $24.92 $31.50 * Source: Dun's Industry Ratios. The data have been adjusted for this case. Case 2 Other fixed assets. 0 _101 200 215 399 200 54.491 Total assets S2.22 3 $3.190 56 343 $8.641 $11.995 210 $ 405 $ 551 $ 771 $1,080 $ 1,512 35 _39 42 59 - 82 _135 Liabilities: Accounts payable Short-term debt Total current liabilities Long-term deb.. Total liabilities Equity: 245 444 593 830 1,162 1.647 17 19 _21 27 _SO _17 262 463 614 857 1,212 1,664 Common stock 2,062 2,062 2,062 2,062 2,062 2,062 3.424 Retained earnings ) (101 665 1.815 5.366 8.269 1,961 2,727 5,486 7,428 10,331 Total equity Total liabilities and equity 3,877 $4.491 $3.190 $8.641 $11.995 S2.22 3 Figure 2 CHEM-MED COMPANY Balance Sheets As of Dec. 31, years ended: Pro Forma Balance Sheets As of Dec. 31, years ended: , 2016 2017 2018 2013 2014 2015 Dr. Swan had lunch with his banker just recently, and the banker mentioned several restrictive covenants that the company would have to meet if it came to the bank for financing. Dr. Swan pulled a sheet of paper from his desk drawer and glanced at it. There were three covenants listed: The current ratio must be maintained above 2.25 to 1. The debt-to-assets ratio must be less than .3 to 1. Dividends cannot be paid unless earnings are positive. Dr. Swan didn't think he would have any trouble with those, but he wasn't sure. Then he suddenly remembered he was supposed to meet a representative from one of the local supermarket chains (who supplied Chem-Med with rooster combs) in five minutes. He hurriedly put his papers away and wished he had more time to analyze the numbers before the next board of directors meeting. (The financial information is presented in Figures 1, 2, and 3.) Assets: $ 124 $ 103 $ 167 $ 205 $ 422 $ $ 101 Cash and equivalents.. Accounts receivable. 100 409 564 907 1,495 2,351 Inventories...... 151 302 960 1,102 1,443 798 Other current 59 29 41 57 11 28 403 Total current assets 873 1,720 2,255 3,417 3,261 1,901 2.298 2,917 4,301 5.531 8,923 Property, plant, and equipment Less: accumulated depreciation Property, plant, and equipment, net 81 346 413 Figure 3 522 588 82 2,216 1,820 2,571 3,888 5,009 8,335 CHEM-MED COMPANY Income Statements 2013-2015 (in 000s) Pro Forma Income Statements 2013 2014 2015 2016 2017 2018 Net sales (all credit) $ 777 $3,051 $3,814 $5,340 $7,475 $10,466 Cost of goods sold 995 1,040 1.716 2.154 3,054 257 520 2,056 2,774 3,624 5,321 Gross profit Selling, etc., expenses. Other inc (exps)" 7,412 2,645 610 705 964 1,520 2,120 0 0 500 _ __ Operating profit (90) 1,351 1,810 2,604 3,201 4,767 Interest expense.. _25 94 202 _302 (101) 1.276 1,716 2,402 2,899 4,333 Income before tax Income taxes (40% in 1986; 33% thereafter) 0 510 566 793 957 1.430 $ 2.903 Net income. $766 $1,150 $1,609 $1.913 101 0 0 0 0 0 Dividends paid Increase in retained earnings. $ 766 $1,150 $1,609 $1,943 $ 2,903 101 2,326 2,347 2,347 2,347 Average number of shares** Earnings per share. 2,326 2,347 $ 0.33 $ 0.49 ($) 0.04 $ 0.69 $ 0.83 $ 1.24