

Answered step by step
Verified Expert Solution
Question
1 Approved Answer
What were Apple's total current assets at September 29, 2018, and September 30, 2017? (Enter amounts in millions.) Total current assets September 29, 2018 September
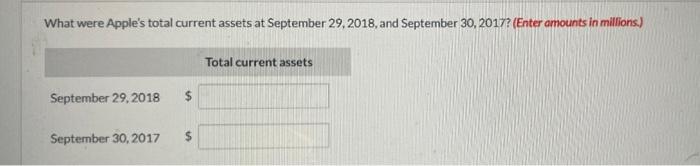
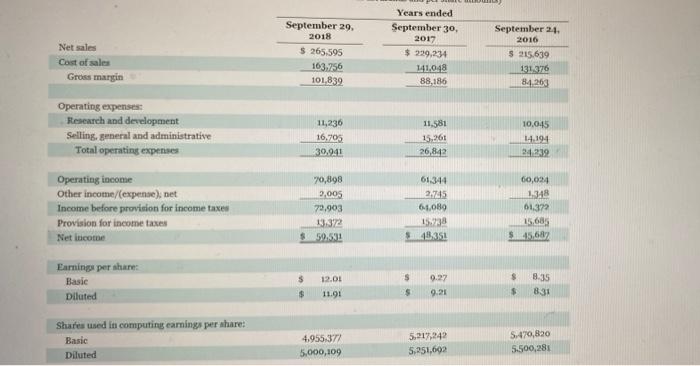
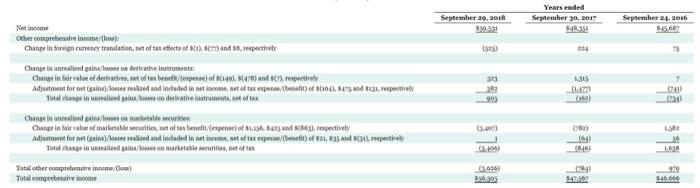
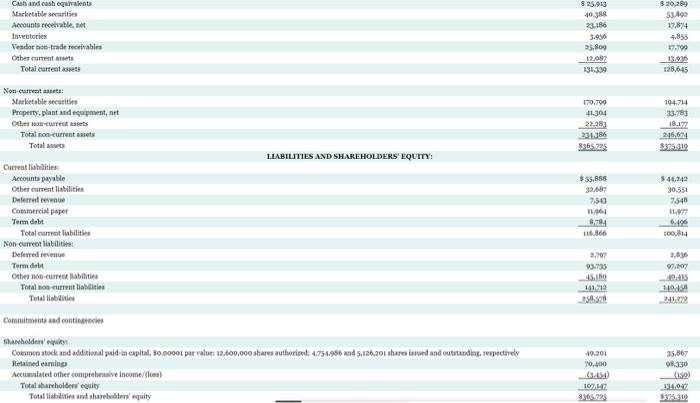
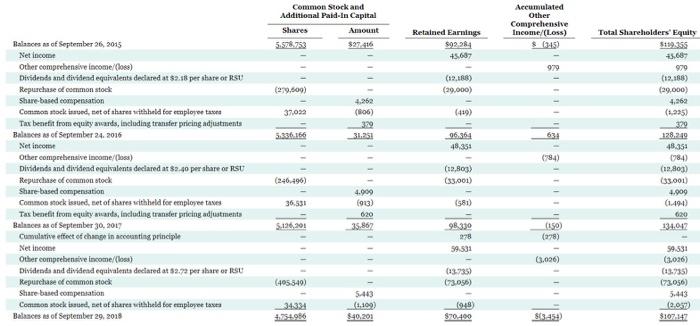
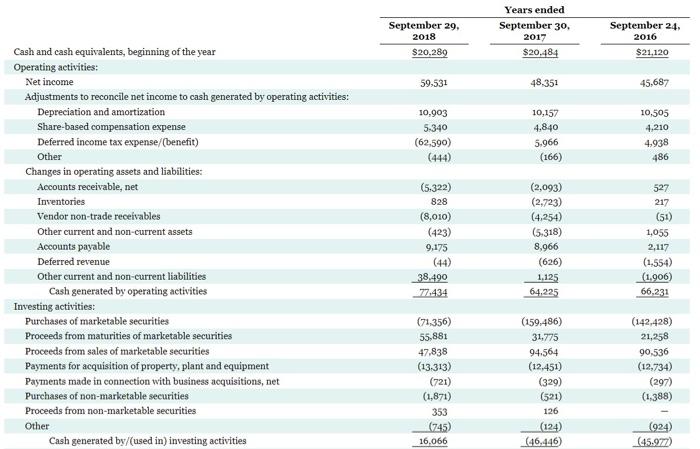
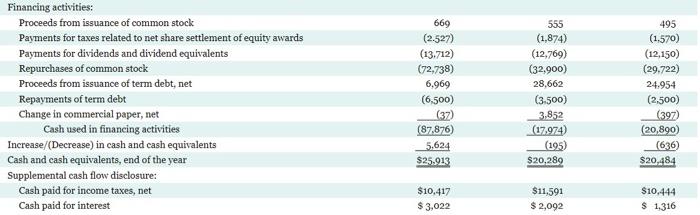 What were Apple's total current assets at September 29, 2018, and September 30, 2017? (Enter amounts in millions.) Total current assets September 29, 2018 September 30, 2017 Net sales Cast of sales Gross margin September 29, 2018 $ 265.595 163.756 101.839 Years ended September 30, 2017 $ 229,234 141048 88,186 September 24, 2016 $ 215.639 131376 84.263 Operating expenses Research and development Selling, smeral and administrative Total operating expenses 11,236 16,705 30,941 11,581 15.261 26,842 10.045 14.194 24.239 Operating income Other income/(expense), net Income before provision for income taxes Provision for income taxes Netcome 70,898 2,005 79.903 13:37 $50.51 61344 2,745 61.08 60,024 1.348 01.372 15,685 $_45,687 $48.351 $ Earnings per share: Basic Diluted | 0 11.9: 9.27 9.21 $ $ 8.35 831 $ S Share used in computing earnings per share: Basic Diluted 4,955,377 5,000,109 5.217,242 5.951,602 5.470,820 5.500,281 September 29, 2018 $59531 Years ended September 30, 2017 348353 September 2016 $4566 Gas) 224 75 e income Other comprehensive Income out Change in foreign curteney translation, dit of tat etincta of tax. 37) and 38, respecthy Change in the galloses derivative in the Cangelistair value of dertives et of tax benefit/expense) of 141,648) respectively Adjustment for sit confined and included in het ac, teftas esperan (tetarlit) 100, sers and $13, expectively 0.470 32 90 6) (407) 782) 56 Change in die marktleie Change in fata of tabletes, bet of text of 81.156,6425 and (863), espectively Att for sine realised and induded in netice, set of tax expe/bfit) of 1,835 and 3 repehely Toalhagen darable, et Total other comprehrane income Totalcogebale income 1698 0.036) $0.93 919 546 $25.913 Cash and casheguments Marketable seats Accounts receivable, et Inventories Vendor non-trade receivables Othereuments Total current assets 40388 23.186 3.055 25.809 12.00 136.330 320.289 53,892 17,874 4.855 27.799 13.06 128,645 Non-creates: Marketable securities Property, plant and equipment, net Other non-curre Total non-currentes Totalt 170.799 41.304 2,283 2313 3965225 104,714 33.783 18.17 246,621 3375319 LIABILITIES AND SHAREHOLDERS' EQUITY: $ 55,888 32.00 $40.242 30.551 7.50 7.545 1 Curreat liabilities: Accounts payable Other current liabilities Deferred revenue Commercial paper Term debet Total current liabilities Non current liabilities Deferred revenue Todelet Other non abilities Total surrent lite Total Mobile 11/06 8.74 116.366 100,814 2.1 93.735 SIMO 141212 SA 2.896 97.107 19.415 1.1958 2413 Commitments and contings 35.367 08.130 sholder Common stock and additional puid in capital, 90.00001 per values 23,600,000 shares authoriset: 4.754,986 and 5.126.001 shares ined and outstanding, serpectively Hetained earning Accumulated other comprehensive income/(0) Total shareholder Total liabilities and shareholders' equity 40,201 70.000 6.51) 1077 10 353 Common Stock and Additional Paid-In Capital Shares Amount 5.576.753 $27.416 Accumulated Other Comprehensive Income/(Loss) $ 1945) Retained Earnings $92284 4560 999 79.609) (12.188) (29.000) 37.092 4.262 (806) 329 31.25 (419) Total Shareholders' Equity $119.355 45,687 979 (12.185) (29,000) 4.260 (1925) 329 178.219 43.35 084) (19.803) (33.001) 4.909 (1401) 020 134,042 5.336.166 634 96.36 48.35 Balances as of September 26, 2015 Net income Other comprehensive income (os) Dividends and dividend equivalents declared at $2:16 pet share on RSU Repurchase of common stock Share-based compensation Cominton stock issued, net of share withheld for employer tason Tax benefit from equity awards, including transfer pricing adjustments Balace of September 24, 2016 Net income Other comprehensive income/losa) Dividends and dividend equivalents declared at $2.40 per share or RSU Repurchase of common stock Share-based compensation Common stock issued, set of shares withheld for employee taxes Tas benefit from equity wards, including transfer pricing adjustments Balances of September 30, 2017 Camulative effect of change in accounting principle Net income Other comprehensive Income/los) Divsdenada and dividend equivalente declared at $2.72 per share or RSU Kepurchase of common stock Share based compensation Common stock issued, set of share withheld for employee taxes Balance of September 29, 2018 (794) (19,803) (33.001) (246-496) 4.909 36.531 (581) (923) 620 35,862 5.126,201 98.330 278 59.531 (150) (278) (3.026) (495349) 03.735) 03.09) 59.331 (3.026) (13.735) (73.056) 3.443 e. $107.147 34334 5443 14.100) $40.201 1048 $70.400 September 29. 2018 $20.289 Years ended September 30, 2017 $20.484 September 24, 2016 $21,120 59.531 48,351 45,687 10,903 5.340 (62,590) (444) 10,157 4,840 5.966 (166) 10,505 4,210 4,938 486 Cash and cash equivalents, beginning of the year Operating activities: Net income Adjustments to reconcile net income to cash generated by operating activities: Depreciation and amortization Share-based compensation expense Deferred income tax expense/(benefit) Other Changes in operating assets and liabilities: Accounts receivable, net Inventories Vendor non-trade receivables Other current and non-current assets Accounts payable Deferred revenue Other current and non-current liabilities Cash generated by operating activities Investing activities: Purchases of marketable securities Proceeds from maturities of marketable securities Proceeds from sales of marketable securities Payments for acquisition of property, plant and equipment Payments made in connection with business acquisitions, net Purchases of non-marketable securities Proceeds from non-marketable securities Other Cash generated by/(used in) investing activities (5.322) 828 (8,010) (423) 9,175 (44) 38.490 77.434 (2,093) (2,723) (4.254) (5.318) 8,966 (626) 1.125 64,225 527 217 (51) 1,055 2,117 (1.554) (1.906) 66,231 (71,356) 55.881 47.838 (13.313) (721) (1,871) 353 (745) (159.486) 31.775 94.564 (12,451) (329) (521) 126 (124) (46,446) (142,428) 21,258 90,536 (12,734) (297) (1.388) (024) (45.977) 16.066 Financing activities: Proceeds from issuance of common stock Payments for taxes related to net share settlement of equity awards Payments for dividends and dividend equivalents Repurchases of common stock Proceeds from issuance of term debt, net Repayments of term debt Change in commercial paper, net Cash used in financing activities Increase/(Decrease) in cash and cash equivalents Cash and cash equivalents, end of the year Supplemental cash flow disclosure: Cash paid for income taxes, net Cash paid for interest 669 (2.527) (13.712) (72,738) 6,969 (6,500) (37) (87.876) 5,624 $25.913 555 (1,874) (12,769) (32,900) 28,662 (3.500) 3.852 (17,974) (195) $20,289 495 (1.570) (12,150) (29.722) 24.954 (2,500) (397) (20,890) (636) $20,484 $10.417 $3,022 $11,591 $ 2,092 $10,444 $ 1.316
Step by Step Solution
There are 3 Steps involved in it
Step: 1

Get Instant Access to Expert-Tailored Solutions
See step-by-step solutions with expert insights and AI powered tools for academic success
Step: 2

Step: 3
Ace Your Homework with AI
Get the answers you need in no time with our AI-driven, step-by-step assistance
Get Started
Portfolio Of Marketing Audits Company Self Assessment Audits
Authors: David Crosby
1st Edition
1902433157, 978-1902433158