

Question: What will be the exit strategy for Nantucket Nectars. Explain the financial and growth analysis of the company. ( Please use exhibits to do calculations
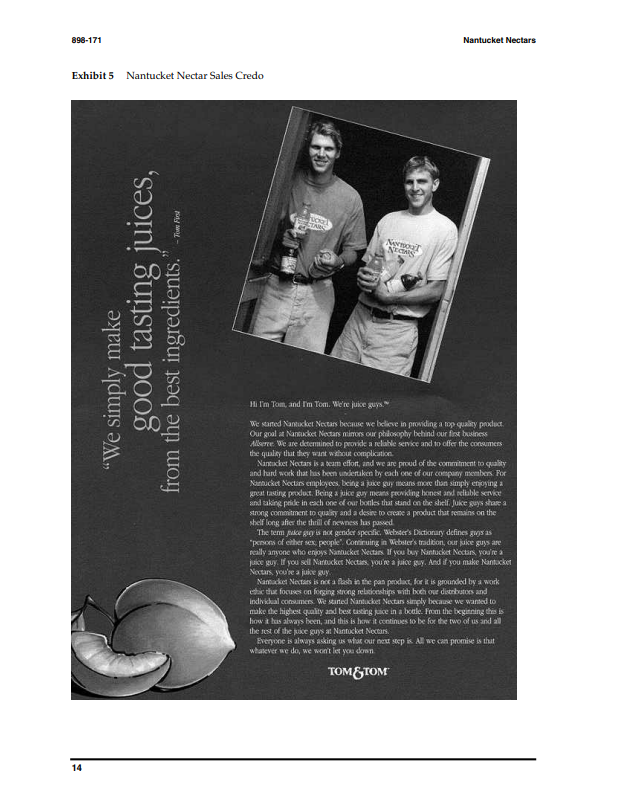
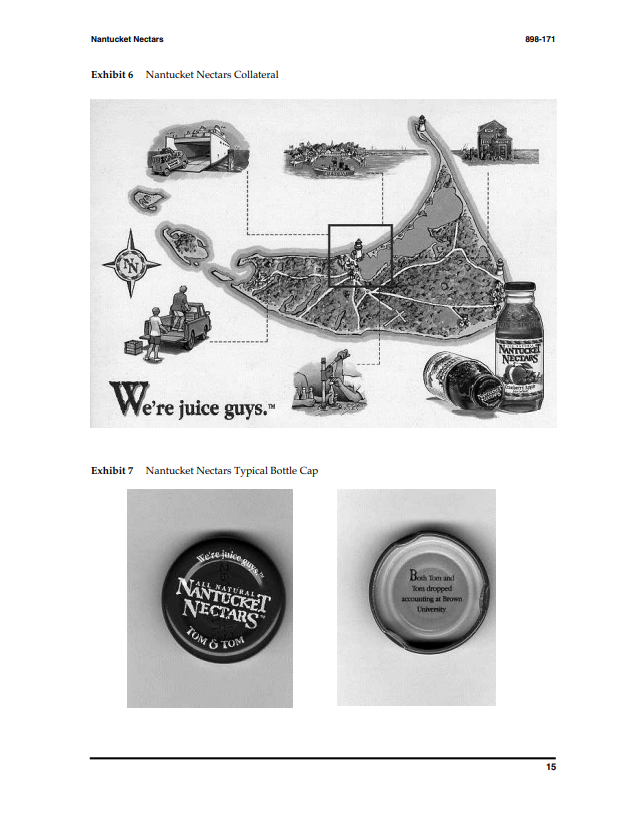
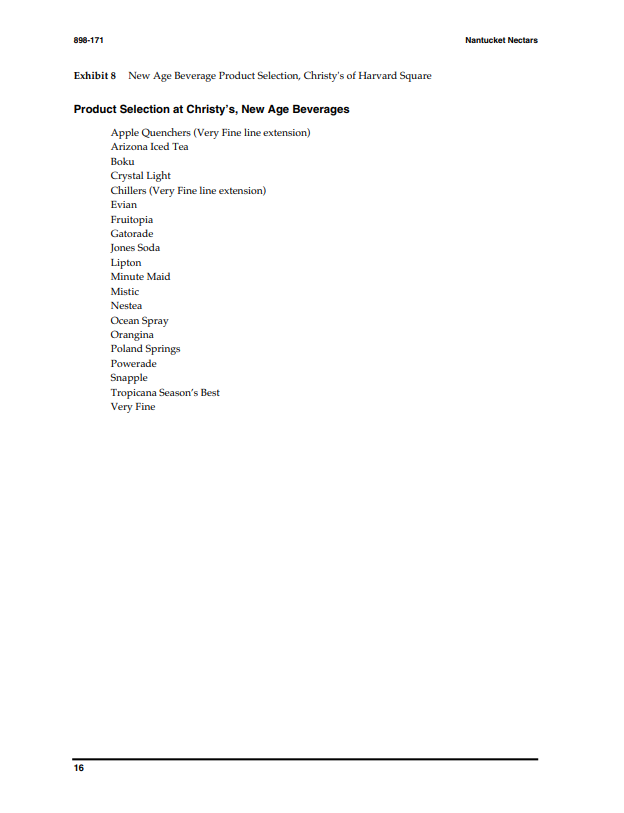
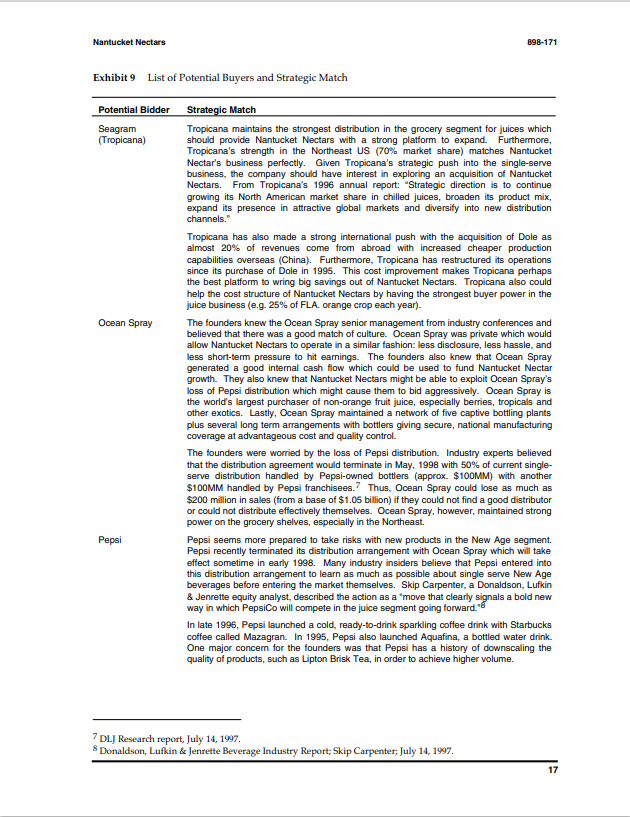
What will be the exit strategy for Nantucket Nectars. Explain the financial and growth analysis of the company. ( Please use exhibits to do calculations in excel )
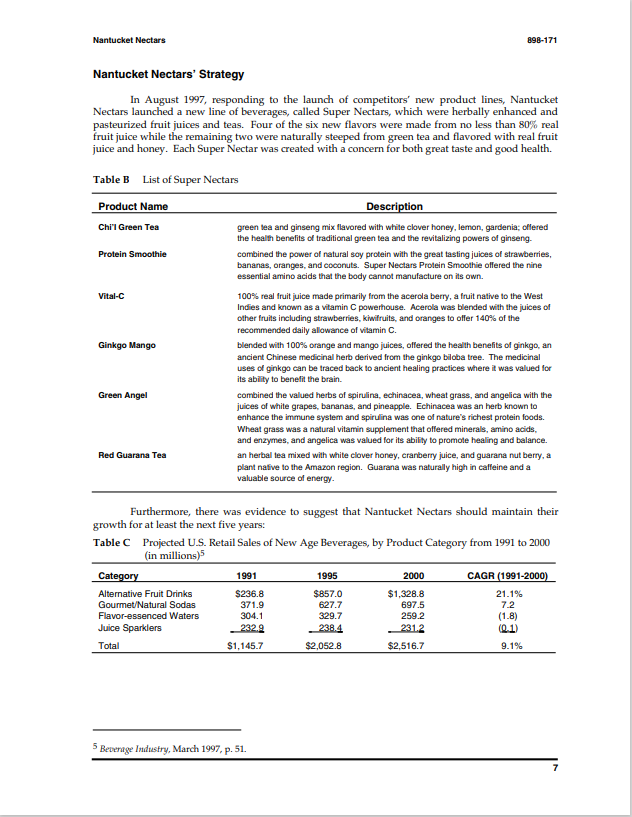
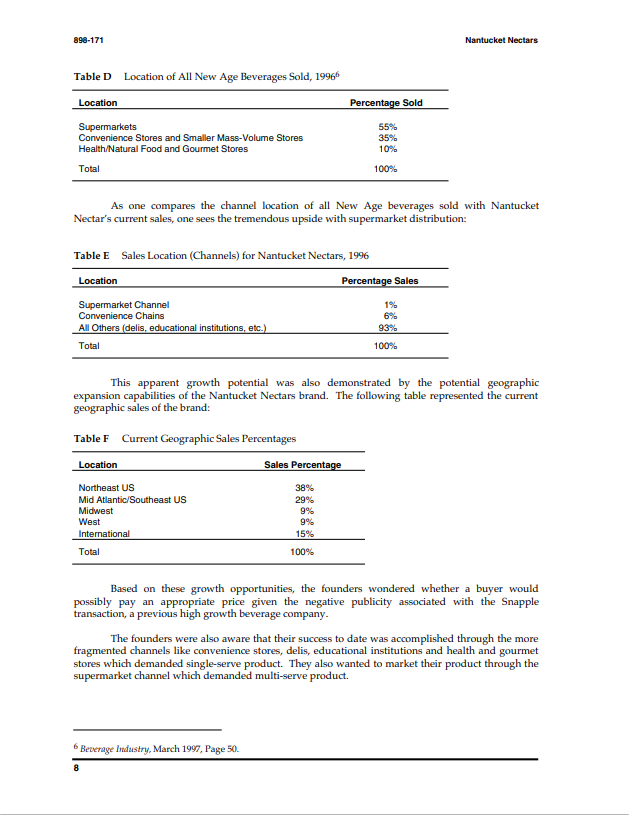
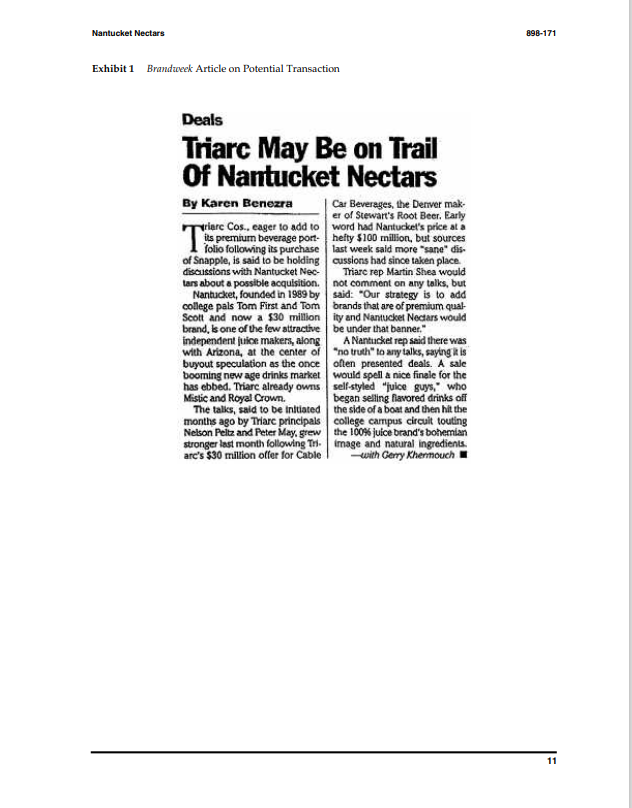
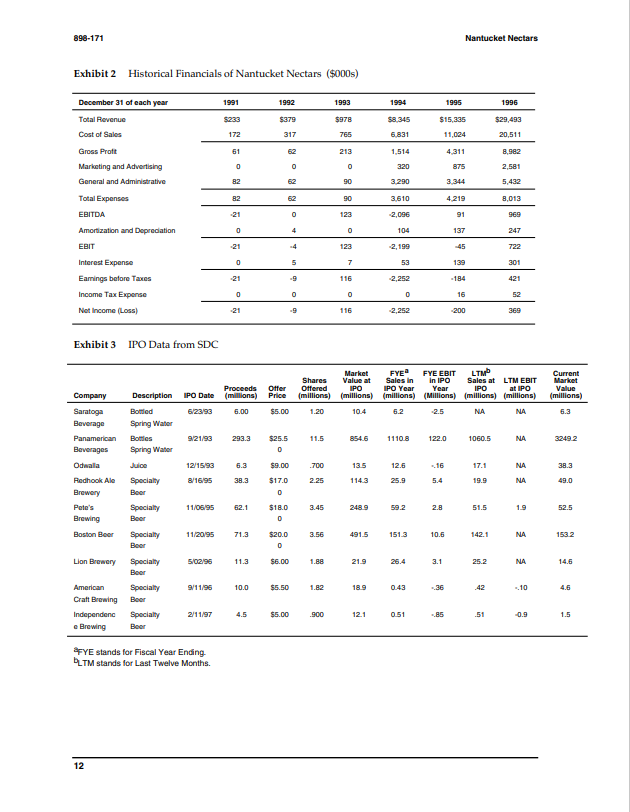
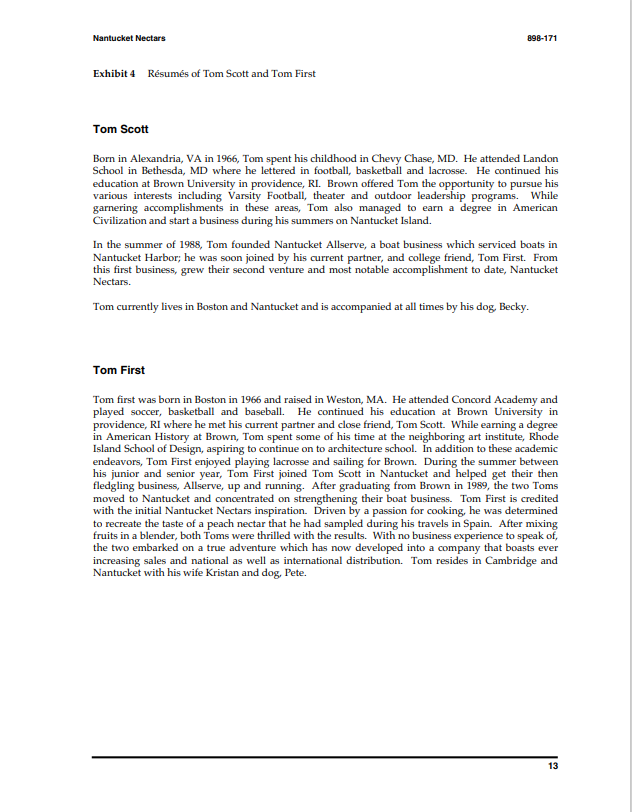
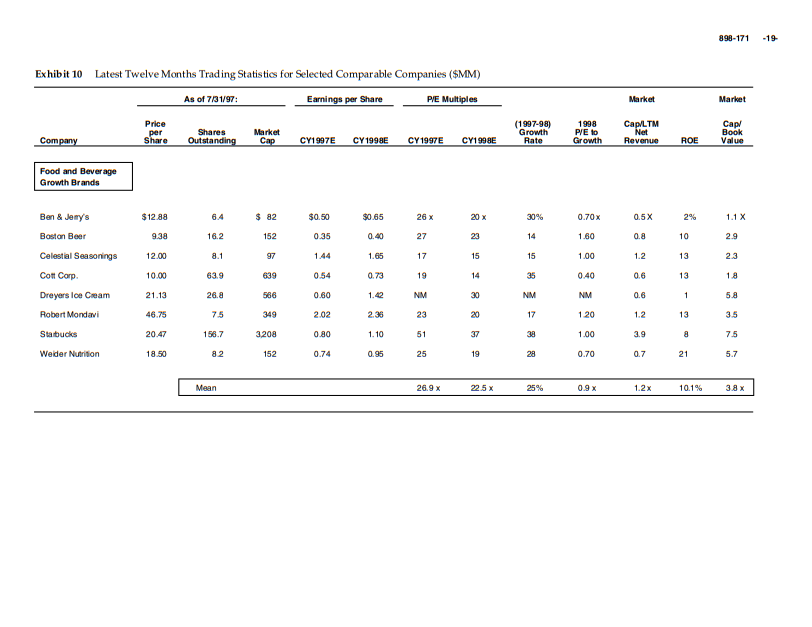
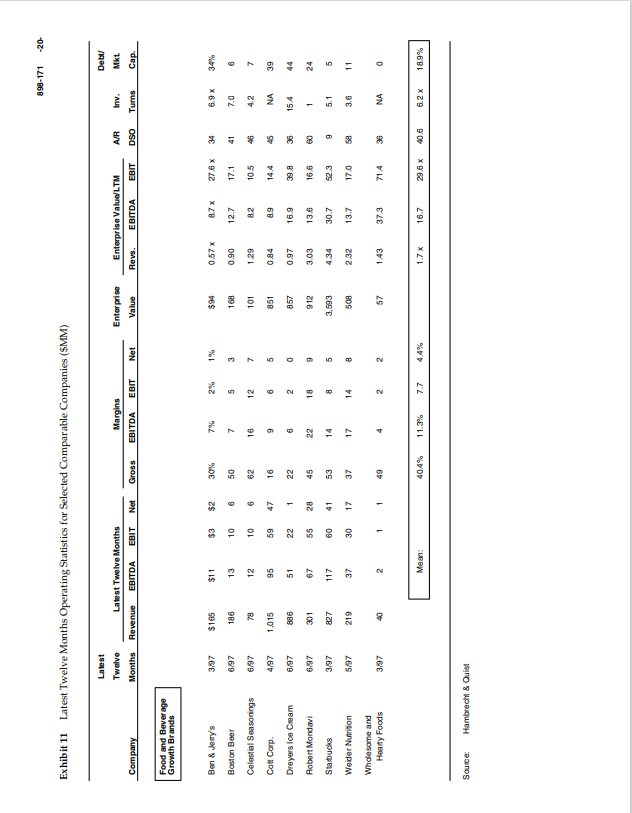
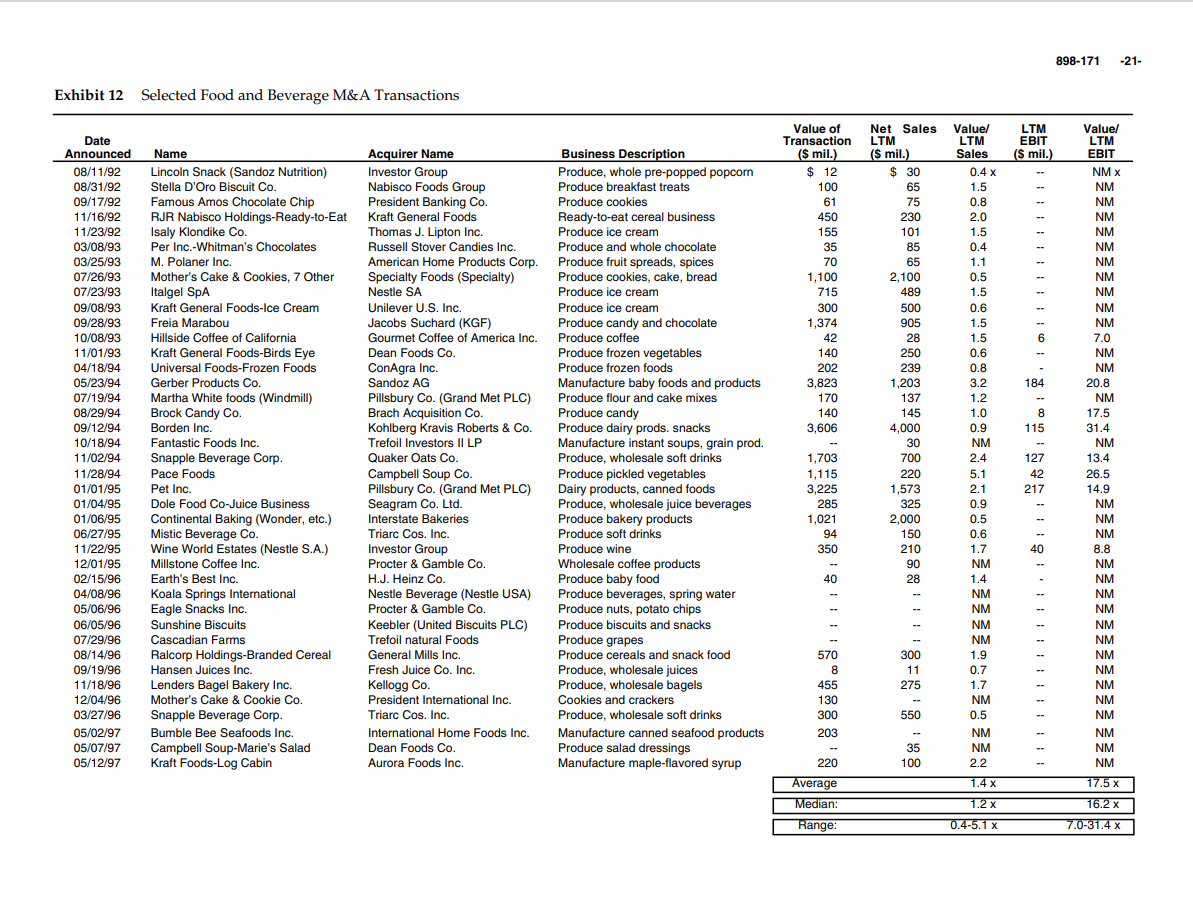
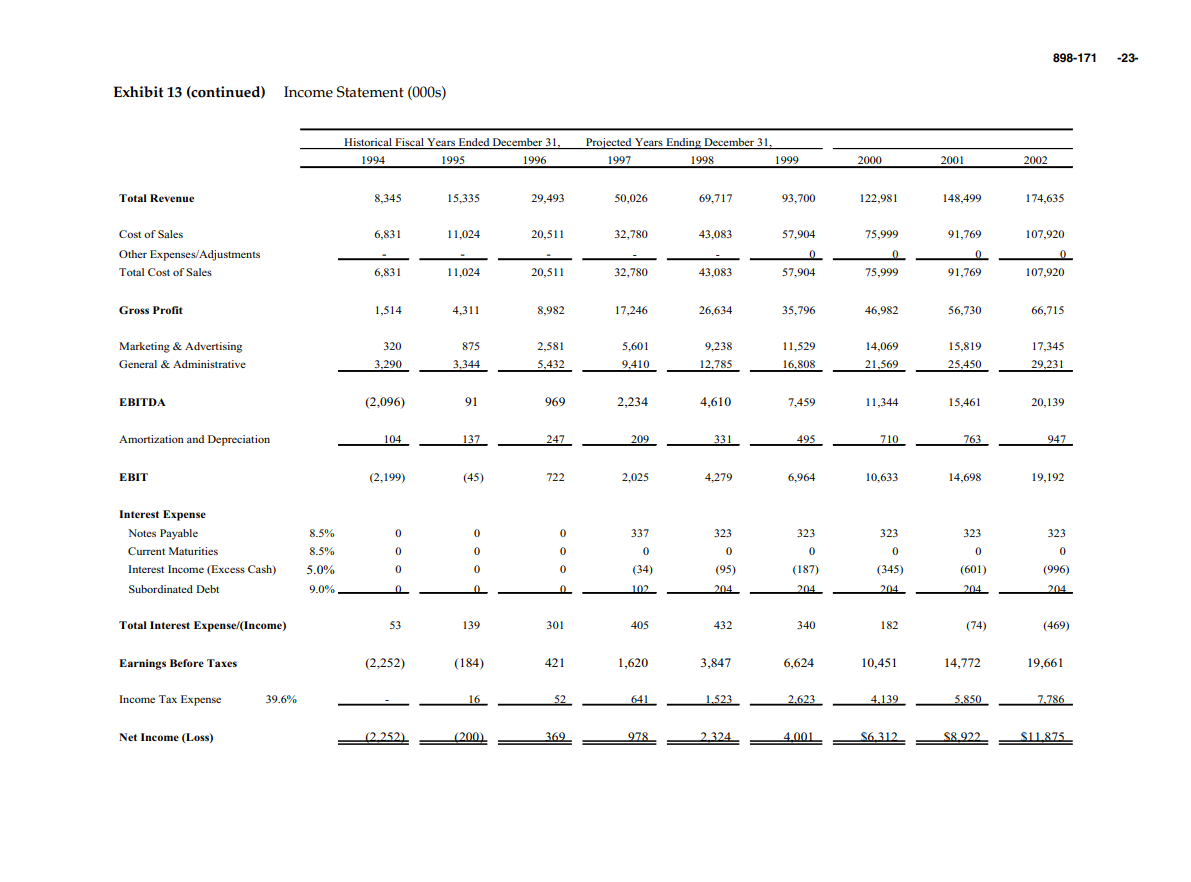
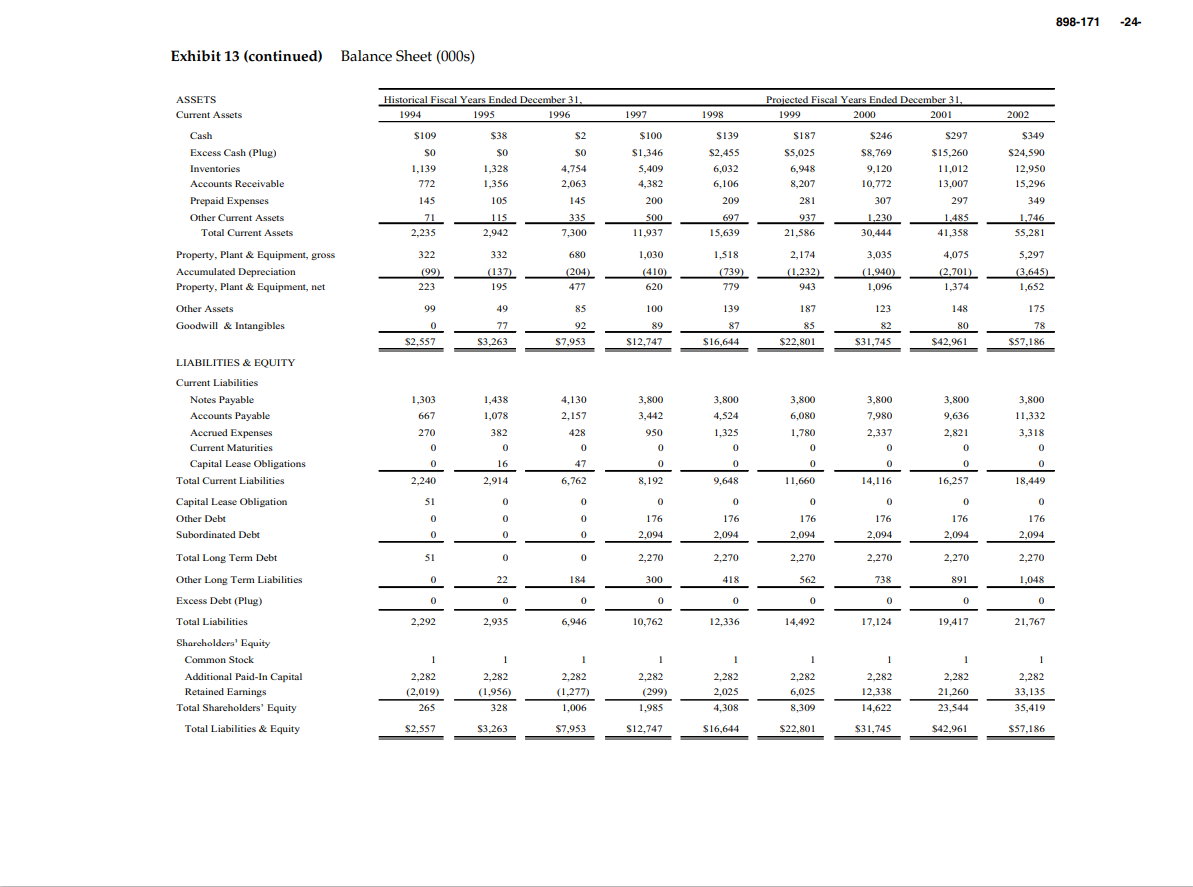
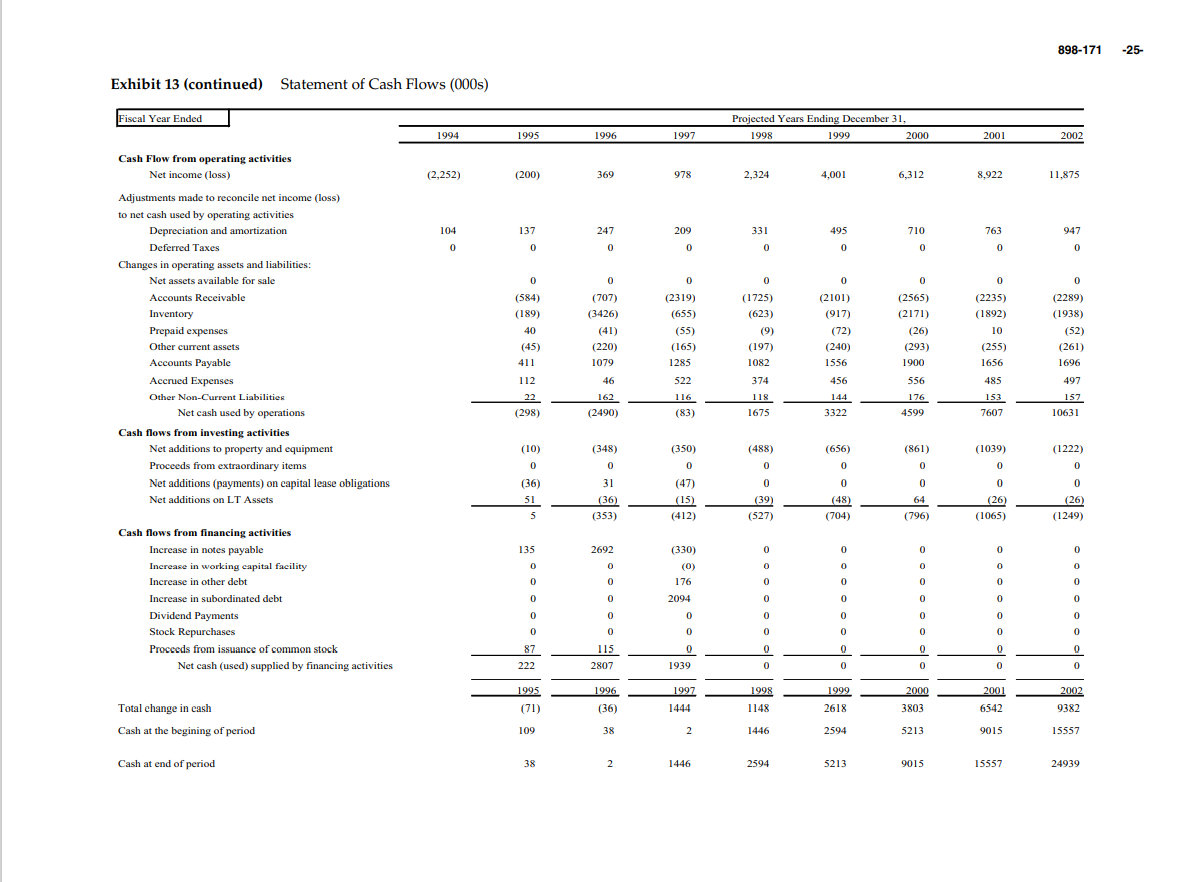
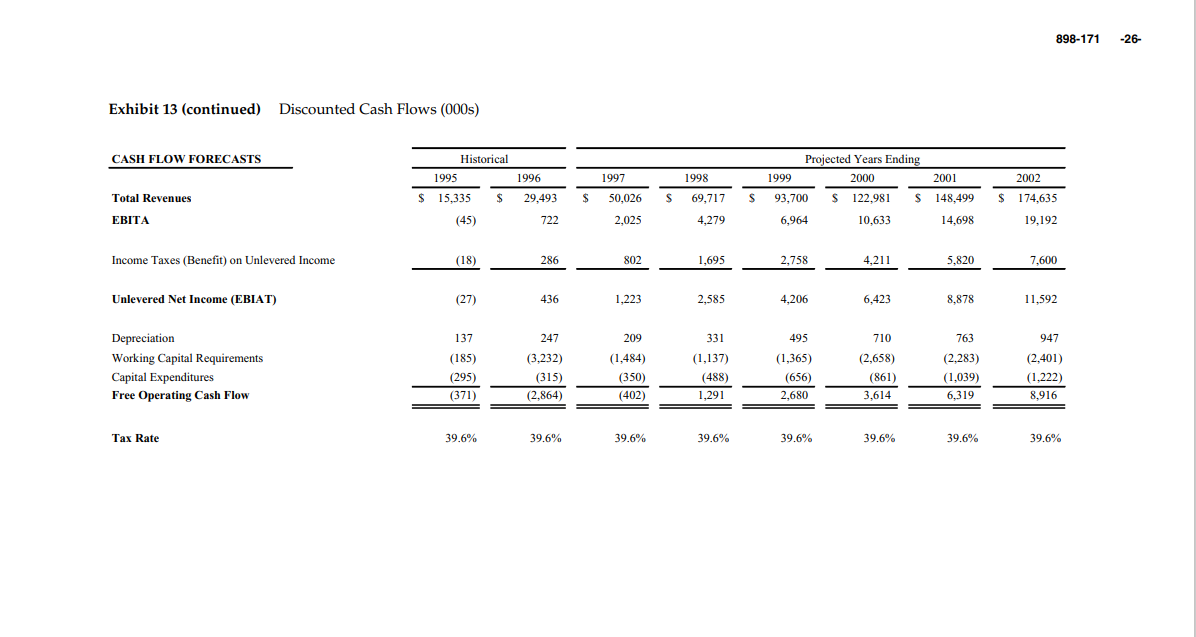
898-171 Nantucket Nectars It was certainly exciting to have some companies interested in acquiring Nantucket Nectars. But, should the founders sell at this time? They had originally planned to take the company public. The company was doing great, better than they had ever imagined. See Exhibit 2 for historical financials and Exhibit 3 for recent valuations of initial public offerings. But, many people, particularly company founders who were running their newly public companies, were telling them that going public wasn't a completely positive experience. They wondered whether the company was even ready to go public. Regardless of their decision about going public, should they continue negotiating with potential buyers to find out the market value of their company? Ultimately, they needed to decide whether to sell the company or begin the initial public offering process. Of course, operating Nantucket Nectars as a stand alone company was always an option. Background Tom Scott and Tom First met while students at Brown University. (See Exhibit 4 for their rsums.) During their summers, the two created Allserve, a floating convenience store serving boats in the Nantucket Harbor. The founders decided to return to Nantucket after graduation to continue this service business. At the time, they sold ice, beer, soda, cigarettes and newspapers and performed services such as pumping waste and delivering groceries and laundry for boats in the Harbor. The founders did not even sell juice at that time. As First recalled, "we started what was basically a floating 7-Eleven."1 During the winter of 1990, First recreated a peach fruit juice drink that he had discovered during a trip to Spain. The drink inspired the two founders to start a side-business of making fresh juices. In the spring of 1990, the founders decided to hand bottle their new creation and sell them off their Allserve boat. "We started by making it in blenders and selling it in cups off the boat. But we also put it in milk cartons and wine bottlesthere was a wine guy on the islandbasically anything that we could find.2" Everyone loved the product, prompting the founders to open the Allserve General Store on Nantucket's Straight Wharf. Soon thereafter, other Nantucket stores started carrying the product. In its first year, Nantucket Allserve sold 8,000 cases of its renamed juice, Nantucket Nectars, and 20,000 the following year. Financing In the first two years, the two founders invested their collective life savings, about $17,000, in the company to contract an outside bottler and finance inventory. For the next two years, Nantucket Nectars operated in an undercapitalized state on a small bank loan. Tom Scott recalled the situation: We were scraping along. Everything was going back into the company. By early 1993, our few employees hadn't been paid in a year, never mind that Tom and I hadn't paid ourselves in three and a half years. But we worked all sorts of odd jobs on the side, especially during the winter. It was especially tough because we could see the juice really taking off. Ultimately, the two founders and Ned Desmond, who would later become the Regional Director of Sales and Marketing, persuaded Mike Egan to invest $600,000 in Nantucket Nectars in exchange for 50% of the company. The founders originally met Mike Egan while serving his boat in Nantucket Harbor during the early days of Allserve. Mike Egan was the founder and former CEO of Alamo Car Rentals and still maintained 93% of that company's stock. While the founders were Beverage Aisle, February 1996. 2 Beverage Aisle, February 1996. 2 Nantucket Nectars 898-171 concerned about ceding a controlling share to an outsider, they needed the money and had no other options. Egan performed the function of trusted advisor while not meddling in the day-to-day operations of the business. As Egan explained, "I really made the investment because it makes me wake up in the morning and feel like I'm twenty-five again, trying to grow another company." The founders used the capital to improve distribution and increase inventory. First, they secured better, independent bottlers. Given their lack of credit history and Snapple's fantastic growth, which utilized the majority of good bottler capacity, Nantucket Nectars previously had difficulty finding quality bottlers at an affordable price. Secondly, they built their own distribution arm with the equity capital. The founders needed to decide how to distribute their beverages in the early days, deciding between three options: implement a large advertising campaign to build brand awareness while moving their product through an independent distributor channel which would carry multiple brands at the same time; contact retailers directly to create trade promotions; or, distribute the product yourself. Given that Nantucket Nectars could not afford the first two strategies, the founders created a unique private distribution strategy where they themselves sold, delivered, and stocked the product. Ned Desmond explained: We were doing it all. We leased some warehouse space, bought an old van, and went up and down the street selling Nantucket Nectars and our passion to make the brand succeed. The retailers immediately loved our story and enjoyed seeing us stock the shelves ourselves. Becoming our own distributor allowed us to control the positioning of the product. We often rearranged the shelves to ensure that Nantucket Nectars was better positioned than Snapple. In order to speed up their growth, the founders obtained the exclusive rights to distribute Arizona Iced Tea in Massachusetts. Boston was one of the top 5 New Age beverage markets in the United States and Arizona Ice Tea needed a strong Boston position in its own race with Snapple. While hoping to harness the on-the-street, upstart energy" of the Nantucket Nectars team, Arizona Iced Tea was more than prepared to cancel the contract if Nantucket Nectars did not perform. The founders wanted to piggyback off the strong brand and higher volumes of Arizona loed Tea to build their own distribution arm and to get more outlets for their own products in the market. Within three months the distribution division grew from seven to one hundred employees and from 2,000 to 30,000 cases sold per month. At the same time, the founders repackaged and reformulated their own product while convincing small stores to carry Nantucket Nectars along side the red-hot Arizona Iced Tea. By the end of 1994, revenues surpassed $8 million. Marketing and the Creation of a Brand Most New Age beverage companies must have clear differentiation because under- capitalization did not allow traditional, expensive advertising strategies and slotting charges for garnering shelf space. Nantucket Nectars relied on creative packaging, rapid and original product introductions, word-of-mouth and a memorable story line. Achieving this combination of low-priced but effective marketing was extremely difficult. Knowing this difficulty, the founders decided to focus on a simple vision without the help of any outside agencies: create a high quality product and 3 Term given to trendy, more healthy beverages such as ready-to-drink teas, sports drinks and juices. 898-171 Nantucket Nectars sell a persona. The result was the creation of a unique brand personality based on the start of the company on Nantucket. In the early days, Nantucket Nectars focused on creative but mundane ways of creating name recognition at a minimal cost. The company set up samplings, giveaways, sponsorship for road races and summer sports leagues which usually required only donation of product. In addition, the company set up publicity stunts including salespeople dressed up as fruits. With the increased capital raised from Egan, the founders segued into radio ads as a means to push the Nantucket "story." The founders described early mishaps in radio ads and placed messages underneath their bottle caps in order to attract consumer interest. See Exhibit 5, Exhibit 6 and Exhibit 7. For example, an early radio ad described how Ned Desmond, on the first sales trip to Boston, crashed the Nantucket Nectars van on Storrow Drive destroying all the juice. Another radio ad explained how early employee Larry Perez accidentally dropped the proceeds from the first sale into the harbor. Growth The early days were extremely frustrating for the two founders. While customers clearly liked the product, Nantucket Nectars only had three flavors-Cranberry Grapefruit, Lemonade and Peach Orangeand the founders were completely unsure of how to grow the business. Tom Scott explained: "The frustrations that we dealt with were immense. We didn't know what point-of-sale was, we didn't know what promotion was, we didn't know what margin we should be making. * Product development As a means to differentiate, Nantucket Nectars committed to creating high quality, all natural juice beverages without regard for the margins, the quality of the product came first. This strategy translated into replacing high fructose corn syrup with only pure cane sugar. The founders believed that using pure cane sugar would improve the taste without leaving the consumer thirsty like other sweetened beverages. Furthermore, the founders used four times the juice of other major brands to improve on their mantra of quality and taste. The founders also differentiated their product by introducing a proprietary 17.5 ounce bottle to complement their existing 12 ounce line as compared to competitors' standard 16 ounce bottle. From the original three juice flavors, Nantucket Nectars developed 27 flavors across three product lines during the first three years: 100% fruit juices, juice cocktails and ice teas/lemonades. Sales and distribution Having started out as a "floating 7-Eleven," the founders had been distributors long before they had been suppliers and marketers of juice. At first, the founders structured their in-house distribution arm to target delis, sandwich shops, small markets, gourmet food shops, convenience stores and food service cafeterias. The Arizona Iced Tea contract and their own self-confidence lead them to launch a broader distribution business with the hopes of carrying multiple brands and higher volumes at lower costs into the New England market. This new business allowed them to penetrate even more of the small outlets and to begin building up a presence in the larger stores and chains. They learned the "ins and outs" of the distribution business and forged relationships with many independent distributors around the country. Unfortunately, they also learned that the economics of the distribution business really required one of the "big brands" or you just could not carry the overhead. Having "made every mistake in the book," the founders gained a new respect for the talent and time it took to scale up a business. In 1995, the founders sold their distribution arm after losing $2 million in the previo year. They believed that their brand was firmly entrenched on the shelves and were confident that any adverse effects on revenue growth caused by selling the distribution business would be small. The founders concentrated on marketing their own product and developing the Nantucket Nectars brand name. The priority at Nantucket Nectars was "moving the juice." 4 Beverage Aisle, February 1996. Nantucket Nectars 898-171 The company switched the distribution of Nantucket Nectars to a combination of in-house salesforce and outside distributors. The company granted exclusive rights to sell Nantucket Nectars products within a defined territory while allowing those distributors to carry other beverage products as well. The company wrote multi-year agreements with most of its distributors. When an order was placed at company headquarters from the outside distributor, the company selected an outside trucking source to pick up the products from the bottler of the beverage to deliver to the appropriate distributors. The distributors then sold and delivered the product to retail outlets from their warehouses using their own salespeople and delivery drivers. The company initiated incentive programs aimed at distributors and their salespeople to promote Nantucket Nectars through stocking, merchandising and retail sales deals. These programs, which were budgeted individually by territory, were meant to gain shelf space and visibility. With the direct salesforce, Nantucket Nectars called the store accounts to sell the product. The salesforce also employed the strategy of visiting all small retailers to make sure that the product was displayed well, "eye to thigh" and also to check the distributor's work. The strategy was to build steadily a sustainable organization through strong relations with either the best distributors or individual vendors. As Tom Scott explained, "we were not trying to build a house of cards, we wanted solid long-term growth." Consumer Tastes and Preferences Nantucket Nectars was fortunate to have caught a new wave emerging in the beverage industry, the "New Age segment, including ready-to-drink teas, water, juices and sports drinks. Tremendous growth occurred in this segment from 1992 through 1995: Table A Three Year Compound Annual Growth Rate for New Age Beverage Segments Category Three Year CAGR (1992-1995) Ready-to-Drink Teas 24% Water 34% Juices 32% Sports Drinks 12% Driving this strong growth were trendy young consumers pursuing healthier lifestyles yet faced with fast-paced lifestyles and shortened lunches. For these reasons, they appreciated large, single-serve packaging of New Age beverages and the "gulpability" of lighter, non-carbonated, natural fruit juices. Competition Competition surfaced in three major ways in the New Age beverage world. First, a competitor might simply undercut in pricing to flood the market while also offering a high quality or innovative product. The second way of competing involved image and brand strength: brand advertising packaging, trade and consumer promotions. Lastly, brands competed, especially the large players in the beverage industry, by blocking the smaller, less powerful players from the retailer shelf space. At Christy's in Harvard Square, the New Age beverages held over 75% of the chilled beverage space with the remainder controlled by traditional carbonated beverages. The proliferation of brands and flavors confused and distracted even the most loyal juice drinker. Promotions, new flavors and even new brands tempted the consumer to try new products. See Exhibit 8 for a list of New Age beverages at the Harvard Square Christy's. So far, more than 100 companies from traditional beverage companies like Coca Cola to regional start-ups like Arizona launched New Age beverages hoping to capture shifting consumer tastes. Product innovation was a critical element of 898-171 Nantucket Nectars competitiveness and created an incredibly fierce battle for shelf space, especially among regional companies focused on differentiating themselves through flavors, packaging and image. Commenting on this competition, Tom First stated: If we had known how unattractive the industry dynamics were before we started our business, we probably would not have started Nantucket Nectars. However, now that we're in the business, we think that the odds of someone replicating what we did are very slim. The industry dynamics and the fast-paced changes within the industry really decrease the probabilities of an early entrant's success. Many industry analysts believed that competition would increase as New Age beverages became the latest battle ground in the Cola Wars. Coke, Pepsi and Seagrams were all fighting to become the best "total beverage company" to serve the masses while also responding to new beverage trends. New Age beverages were an opportunity to bolster flattening cola and alcohol businesses with short-term profits, and to improve their competencies at serving niche markets. These firms supported a portfolio of beverage brands with expensive marketing and sophisticated distribution skills. Their access to supermarkets through controlling shelf space, vending machines, convenience stores and fountain distribution channels combined with mass marketing and brand awareness provided them with distinct advantages in developing brands even though their procedures and image inhibit their ability to exploit non-traditional, rapidly changing market opportunities. Furthermore, scale lowered a beverage company's cost structure by decreasing the cost of per unit ingredients and distribution. Meanwhile, the customer clearly had many substitutes from which to choose (water, carbonated sodas, alcoholic beverages, sports drinks, and other fruit juices and ready-to-drink teas) and had no switching costs. Furthermore, some people questioned the sustainability of any New Age beverage brand given the "fad" status of this segment. Profitability and Cost Management Fiscal year 1995 represented the first year of profitability for the company. The company's margins were among the lowest in the New Age beverage category given the founders' emphasis on quality. Unfortunately, high sales growth forced the founders to focus on increasing production to meet high demand, rather than delivering quality at a favorable cost. Their lower margins were a result of higher quality ingredients in the juices and limited futures contracts in commodity procurement. All natural juice beverages depended on commodities for their raw inputs, placing their margins at risk to the markets. Furthermore, Nantucket Nectars juice cocktails were made with real cane sugar which was more expensive than the high fructose corn syrup used in most competitive products. The company also used four times more fruit juice in its products instead of relying on water and artificial flavorings. Lastly, unlike many competitors, the company offered a full line of 100% unsweetened juices. The company's rapid growth and emphasis on quality ingredients accentuated its competitive disadvantages in raw material procurement and plant scheduling. Because of difficulty in predicting growth, the founders were unable to institutionalize future contracts on ingredients. As a consequence, the company was heavily dependent on the harvests as competitors were more likely to secure products if there were a shortage. For example, due to the poor 1995 cranberry harvest, Nantucket Nectars got no cranberries because Ocean Spray controlled all the supplies. This competitive disadvantage in procurement had an even greater impact on Nantucket Nectar's margins because of the higher fruit content in their products. 6 Nantucket Nectars 898-171 Nantucket Nectars' Strategy In August 1997, responding to the launch of competitors' new product lines, Nantucket Nectars launched a new line of beverages, called Super Nectars, which were herbally enhanced and pasteurized fruit juices and teas. Four of the six new flavors were made from no less than 80% real fruit juice while the remaining two were naturally steeped from green tea and flavored with real fruit juice and honey. Each Super Nectar was created with a concern for both great taste and good health. Table B List of Super Nectars Product Name Description Chill Green Tea green tea and ginseng mix flavored with white clover honey, lemon, gardenia: offered the health benefits of traditional green tea and the revitalizing powers of ginseng. Protein Smoothie combined the power of natural say protein with the great tasting juices of strawberries, bananas, oranges, and coconuts. Super Nectars Protein Smoothie offered the nine essential amino acids that the body cannot manufacture on its own. Vital-C 100% real fruit juice made primarily from the acerola berry, a fruit native to the West Indies and known as a vitamin C powerhouse. Acerola was blended with the juices of other fruits including strawberries, kiwifruits, and oranges to offer 140% of the recommended daily allowance of Vitamin C. Ginkgo Mango blended with 100% orange and mango juices, offered the health benefits of ginkgo, an ancient Chinese medicinal herb derived from the ginkgo biloba tree. The medicinal uses of ginkgo can be traced back to ancient healing practices where it was valued for its ability to benefit the brain Green Angel combined the valued herbs of spirulina, echinacea, wheat grass, and angelica with the juices of white grapes, bananas, and pineapple. Echinacea was an herb known to enhance the immune system and spirulina was one of nature's richest protein foods. Wheat grass was a natural vitamin supplement that offered minerals, amino acids and enzymes, and angelica was valued for its ability to promote healing and balance. Red Guarana Tea an herbal tea mixed with white clover honey, cranberry juice, and guarana nut berry, a plant native to the Amazon region. Guarana was naturally high in caffeine and a valuable source of energy Furthermore, there was evidence to suggest that Nantucket Nectars should maintain their growth for at least the next five years: Table C Projected U.S. Retail Sales of New Age Beverages, by Product Category from 1991 to 2000 (in millions) Category 1991 1995 2000 CAGR (1991-2000) Alternative Fruit Drinks $236.8 $857.0 $1,328.8 21.1% Gourmet/Natural Sodas 371.9 627.7 697.5 7.2 Flavor-essenced Waters 304.1 329.7 259.2 (1.8) Juice Sparklers 232.9 238.4 231.2 (01) Total $1,145.7 $2,052.8 $2,516.7 9.1% 5 Beverage Industry, March 1997, p. 51. 898-171 Nantucket Nectars Table D Location of All New Age Beverages Sold, 19966 Location Percentage Sold Supermarkets Convenience Stores and Smaller Mass-Volume Stores Health/Natural Food and Gourmet Stores Total 55% 35% 10% 100% As one compares the channel location of all New Age beverages sold with Nantucket Nectar's current sales, one sees the tremendous upside with supermarket distribution: Table E Sales Location (Channels) for Nantucket Nectars, 1996 Location Percentage Sales Supermarket Channel 1% Convenience Chains 6% All Others (delis, educational institutions, etc.) 93% 100% Total This apparent growth potential was also demonstrated by the potential geographic expansion capabilities of the Nantucket Nectars brand. The following table represented the current geographic sales of the brand: Table F Current Geographic Sales Percentages Location Sales Percentage Northeast US Mid Atlantic/Southeast US Midwest West International Total 38% 29% 9% 9% 15% 100% Based on these growth opportunities, the founders wondered whether a buyer would possibly pay an appropriate price given the negative publicity associated with the Snapple transaction, a previous high growth beverage company. The founders were also aware that their success to date was accomplished through the more fragmented channels like convenience stores, delis, educational institutions and health and gourmet stores which demanded single-serve product. They also wanted to market their product through the supermarket channel which demanded multi-serve product. 6 Beverage Industry, March 1997, Page 50. 8 Nantucket Nectars 898-171 The Snapple deal Outside of macro-economic conditions and the stock market jitters of October 1997, the Snapple deal profoundly affected the New Age beverage market. In November, 1994, Quaker Oats purchased Snapple from Thomas Lee for $1.7 billion. By 1997, Quaker Oats conceded its defeat, selling Snapple to Triarc for $300 million, while firing their chief executive officer, William Smithburg. Industry experts blamed Snapple's decline on Quaker's problems with Snapple's distributors as well as a new marketing strategy. Quaker Oats replaced Howard Stern and "Wendy the Snapple Lady with the corporate "Threedom is Freedom" advertising campaign. Quaker Oats also attempted to take away the most profitable distribution business from the distributors in order to utilize its own Gatorade distribution arm. Due to expensive legal agreements called "Take or Pay" contracts, Quaker Oats was forced to keep their old distributors or pay exorbitant fees to break away from them. Ultimately, they decided to stay with the old distribution system. However, the old distributors by that time had relegated Snapple to secondary status causing Snapple sales to decline precipitously. Quaker's strategy to drop their old distribution network became known as Snappleization within the distribution industry: a distributor lost its distribution contract after a beverage company was acquired by a bigger player. The acquirer moved distribution either in-house or simply to larger distributors after the first distribution network helped build the market for the beverage Corporate Strategy The founders wondered what to do with the company. They wanted to grow the company but were worried about the associated risks. Given their growth needs, they needed to decide whether to sell a part or all of the company, operate under status quo, or undergo an IPO. Mark Hellendrung, Nantucket Nectars CFO, described the consensus of senior management: "The decision was difficult because we felt comfortable operating our company independently with our current capital structure, under an IPO scenario, or with a strategic partner making an investment in our company." If they decided to proceed with a sale, they wondered how to handle the negotiations in order to maximize the price. How could they hold all the meetings so that their employees would not find out prematurely about the transaction? The founders also worried about whether the ownership structure of the company helped or hindered the negotiation process. By the time of the case, Mike Egan, the individual investor, had aggregated 55% of the company due to follow-on investments which permitted early operating losses. With all these issues, Tom and Tom wondered if they needed advisors to help them with the process? If so, should they hire a local investment banker from Boston or a large investment bank from New York? Should they organize a full blown auction of Nantucket Nectars? Would there be any adverse effects if, after a high profile auction, the founders decided not to sell? Should they pick two strategic players and ask them for a preemptive offer for the company? Or should they identify six or so potential bidders and contact them to assess their interest in entering a bidding process. See Exhibit 9 for descriptions of major potential bidders. Also, how should the founders handle the beginning of a negotiation should they specify a minimum bid or force the buyers to submit their first bids? Lastly, Tom Scott and Tom First wondered how to structure the potential transaction. They both believed strongly in the upside potential of their company but were also concerned about holding the stock of a different company. Should they negotiate the best cash deal possible without a long-term management responsibility or should they negotiate for acquirer stock in order to participate in the company's continued upside? How would the chosen strategy affect the valued employees who had helped build the company? With all these issues swirling around in their minds, Tom Scott and Tom First turned their attention to the potential valuation of their company. 898-171 Nantucket Nectars Valuation Analysis Beyond the numbers and the marketplace, the founders wondered what significant assets and skills within Nantucket Nectars drove their corporate value. The founders decided to hold internal brainstorming sessions to analyze why Nantucket Nectars succeeded and therefore deserved a premium for the brand. The founders came up with the following list of value drivers: Great product: great tasting, all natural product Ability to exploit small, rapidly changing market Current management team opportunities Value of the hranil quirky, Arrentric and A more appealing story than any other juice memorable beverage company great material for a company with a large marketing budget and more Geographic expansion capabilities: current sales distribution power): base and future sales base A stabilizing cost structure Management's knowledge of and experience with the single-serve business: ability to add Access to 18-34 market value to large player rolling out new single- Last good access to single-serve distribution in serve products the New Age beverage market Guerrilla marketing skills Best vehicle for juice companies to expand into juice cocktail category without risking their own brand equity . The founders wondered how all these assets were reflected in the pro formas and the actual valuation of the company. They decided to analyze the valuation in three different ways: discounted cash flow, comparable acquisitions and comparable trading. They wondered if these analyses prepared them for the potential negotiations with the buyers. As Tom First described the situation, 'this kind of analysis tells us nothing about what certain buyers can do for Nantucket Nectars concerning improved cost structure or increased sales through wider distribution. The difficult question is how do we figure out what the value of Nantucket Nectars is to someone else, not just us." The founders believed that most acquirers would provide scale economies on costs of goods sold decreasing costs approximately 10% to 20% depending on the acquirer. See Exhibit 10 for comparable trading, Exhibit 11 for comparable operating statistics and Exhibit 12 for comparable acquisitions. Exhibit 13 shows a basic discounted cash flow based on company pro formas. Furthermore, Nantucket Nectars had rolled out a larger-sized bottle (36 ounce bottle) for the supermarkets but the company was having difficulty securing shelf space in the larger supermarket chains. Sales Aftermath The founders were also very concerned with the outcome after a sale. Nantucket Nectars currently has 100 employees of which there were 15 accountants, 20 marketers, 57 salespeople, 5 sales administrators and 3 quality control people. Depending on the structure of the potential transaction, what would happen to these people? Another major concern was that the culture of the firm would change drastically depending on whether a transaction was consummated and with whom. Nantucket Nectars still maintained a non-formal dress code; it was very uncommon to see anyone dressed in business attire. The organization of the firm was still non-hierarchical with all employees able to approach the two Toms. See Exhibit 14. Tom First described this concern: "Destroying the entrepreneurial spirit that has made the company special is one of my biggest fears. Once you start departmentalizing, you lose that. It is essential that we maintain our culture so that work is still fun." The founders were also concerned about the management involvement of any potential strategic partner. Both founders wanted to continue to run the company if possible. Lastly, the founders did not want to have their effective sales and marketing story negatively affected because of ownership issues. Would consumers continue to enjoy the Nantucket Nectars story if the company were actually owned by a large public company? a 10 Nantucket Nectars 898-171 Exhibit1 Brandweek Article on Potential Transaction Deals Triarc May Be on Trail Of Nantucket Nectars By Karen Benezra Car Beverages, the Denver mak- er of Stewart's Root Beer. Early triarc Cos.. eager to add to word had Nantucket's price at a its premium beverage port hefty 5100 million, but sources of Snapple, is said to be holding cussions had since taken place discussions with Nantucket Nec- Triare rep Martin Shea would tars about a possible acquisition. not comment on any talks, but Nantucket, founded in 1999 by said: "Our strategy is to add college pals Tom First and Tom brands that are of premium qual Scott and now a 530 million ity and Nantucket Nectars would brand, is one of the few attractive be under that banner." independent juice makers, along A Nantucket rep said there was with Arizona, at the center of "no truth" to any talks, saying is buyout speculation as the once often presented deals. A sale booming new age drinks market would spell a nice finale for the has ebbed. Triarc already owns self-styled "juice guys, who Mistic and Royal Crown. began selling favored drinks off The talks, said to be initiated the side of a boat and then hit the months ago by Triarc principals college campus circult touting Nelson Peltz and Peter May, grew the 100% juice brand's bohemian stronger last month following Th. image and natural ingredienis. arc's $30 million offer for Cable with Gerry Khemmouch 11 898-171 Nantucket Nectars Exhibit 2 Historical Financials of Nantucket Nectars ($000s) 1991 1992 1993 1994 1995 1996 $233 $379 $978 $15,335 $29,493 58,345 6.831 172 317 765 11,024 20,511 61 62 213 1.514 4.311 8,982 0 0 0 320 875 2,581 82 62 90 3.290 3.344 5,432 82 62 90 3.610 4 219 8,013 December 31 of each year Total Revenue Cost of Sales Gross Profit Marketing and Advertising General and Administrative Total Expenses EBITDA Amortization and Depreciation EBIT Interest Expense Eamnings before Taxes Income Tax Expense Not Income (Loss) 21 0 123 2,096 91 969 0 4 0 104 137 247 -21 4 123 -2,190 -45 722 0 5 7 53 139 301 21 116 2,252 -184 0 0 0 0 16 52 21 116 -2.252 200 369 Exhibit 3 IPO Data from SDC Proceeds (millions) Offer Price Market FYE FYE EDIT LTM Shares Value at Sales in in IPO Sales at LTM EBIT Offered IPO IPO Year Year IPO at IPO millions) (millions) (millions) (Millions) (millions) (millions) 1.20 10.4 6.2 -2.5 NA NA Current Market Value (millions) 6.00 $5.00 6.3 293.3 $25.5 11.5 854.6 11108 122.0 1060.5 NA 32492 0 Company Saratoga Beverage Panamerican Beverages Odwalla Redhook Ale Brewery Pate's Brewing Boston Boer Description IPO Date Bottled 6/23193 Spring Water Bottes 9/21/93 Spring Water Juice 12/15/93 Specialty 8/16/95 Beer Specialty 11/05195 Beer 6.3 $9.00 .700 13.5 12.5 16 17.1 NA 38.3 38.3 $17.0 2.25 114.3 25.9 5.4 199 NA 49.0 0 62.1 3.45 248.9 59.2 2.8 51.5 1.9 52.5 $18.0 0 11/20/95 71.3 3.56 4915 1513 10.6 142.1 NA Specialty Beer 1532 $20.0 0 5/02/96 11.3 $6.00 1.88 21.9 25.4 3.1 25.2 NA 14.6 9/11/95 10.0 $5.50 1.82 18.9 0.43 36 .42 10 4.6 Lion Brewery Specialty Beer American Specialty Craft Brewing Boer Independenc Specialty e Brewing Beer 2/11/97 4.5 $5.00 .900 12.1 0.51 -85 .51 -0.9 1.5 YE stands for Fiscal Year Ending LTM stands for Last Twelve Months. 12 Nantucket Nectars 898-171 Exhibit 4 Rsums of Tom Scott and Tom First Tom Scott Born in Alexandria, VA in 1966, Tom spent his childhood in Chevy Chase, MD. He attended Landon School in Bethesda, MD where he lettered in football, basketball and lacrosse. He continued his education at Brown University in providence, RI. Brown offered Tom the opportunity to pursue his various interests including Varsity Football, theater and outdoor leadership programs. While garnering accomplishments in these areas, Tom also managed to earn a degree in American Civilization and start a business during his summers on Nantucket Island. In the summer of 1988, Tom founded Nantucket Allserve, a boat business which serviced boats in Nantucket Harbor; he was soon joined by his current partner, and college friend, Tom First. From this first business, grew their second venture and most notable accomplishment to date, Nantucket Nectars. Tom currently lives in Boston and Nantucket and is accompanied at all times by his dog, Becky. Tom First Tom first was born in Boston in 1966 and raised in Weston, MA. He attended Concord Academy and played soccer, basketball and baseball. He continued his education at Brown University in providence, RI where he met his current partner and close friend, Tom Scott. While earning a degree in American History at Brown, Tom spent some of his time at the neighboring art institute, Rhode Island School of Design, aspiring to continue on to architecture school. In addition to these academic endeavors, Tom First enjoyed playing lacrosse and sailing for Brown. During the summer between his junior and senior year, Tom First joined Tom Scott in Nantucket and helped get their then fledgling business, Allserve, up and running. After graduating from Brown in 1989, the two Toms moved to Nantucket and concentrated on strengthening their boat business. Tom First is credited with the initial Nantucket Nectars inspiration. Driven by a passion for cooking, he was determined to recreate the taste of a peach nectar that he had sampled during his travels in Spain. After mixing fruits in a blender, both Toms were thrilled with the results. With no business experience to speak of, the two embarked on a true adventure which has now developed into a company that boasts ever increasing sales and national as well as international distribution. Tom resides in Cambridge and Nantucket with his wife Kristan and dog, Pete. 13 898-171 Nantucket Nectars Exhibit 5 Nantucket Nectar Sales Credo Tow Food SECONDS good tasting juices, We simply make from the best ingredients." Hi I'm Tom, and I'm Tom. We're juice guys. We started Nantucket Nectars buse we believe in providing a top quality product Our goal at Nantucket Nectars minors our philosophy behind our first business Allere. We are determined to provide a reliable service and to offer the consumers the quality that they want whout complication Nantucket Nectars is a beam effort, and we are proud of the commitment to quality and hard work that has been undertaken by each one of our company members. For Nanucket Nectars employees, being a juice guy means more than simply toying a great tasting prxdut. Being juice guy means providing honest and reliable service and taking pride in each one of our boules that stand on the shelf. Juke guys share a strong commitment to quality and a desire to create a product that remains on the shelf long after the thrill of newness has passed The tem uke gi is not gender specific, Webster's Dictionary defines gis is "perces of either sex people. Continuing in Webster's tradition, our fukce guys are really anyone who enjoys Nantucket Nectars If you buy Nantucket Nectars, you're a juice guy. If you sell Nantucket Nectars, you're a juice guy. And if you make Nantucket Nectars you're a juke guy Natacket Nectats is not a flash in the pan podace, for it is grounded by a work chic that focuses on forging strong relationships with both our distributors and individual consumers. We started Nantucket Nextars simply because we wanted to make the highest quality and best wasting juice in a boole. From the beginning this is how it has always been, and this is how it continues to be for the two of us and all the set of the face guys at Nantucket Nectors. Everyone is always asking us what our next step is. All we can promise is that whatever we do, we won't let you do TOMTOM 14 Nantucket Nectars 898-171 Exhibit 6 Nantucket Nectars Collateral NNTOOSI NECTARS G We're juice guys." Exhibit 7 Nantucket Nectars Typical Bottle Cap Ver Boa Toman TALL NATURAL Toe dropped accounting at Brown University NECTARS TOM & TOM 15 898-171 Nantucket Nectars Exhibit8 New Age Beverage Product Selection, Christy's of Harvard Square Product Selection at Christy's, New Age Beverages Apple Quenchers (Very Fine line extension) Arizona Iced Tea Boku Crystal Light Chillers (Very Fine line extension) Evian Fruitopia Gatorade Jones Soda Lipton Minute Maid Mistic Nestea Ocean Spray Orangina Poland Springs Powerade Snapple Tropicana Season's Best Very Fine 16 Nantucket Nectars 898-171 Exhibit 9 List of Potential Buyers and Strategic Match Potential Bidder Seagram (Tropicana) Ocean Spray Strategic Match Tropicana maintains the strongest distribution in the grocery segment for juices which should provide Nantucket Nectars with a strong platform to expand. Furthermore, Tropicana's strength in the Northeast US (70% market share) matches Nantucket Nectar's business perfectly. Given Tropicana's strategic push into the single-serve business, the company should have interest in exploring an acquisition of Nantucket Nectars. From Tropicana's 1996 annual report: "Strategic direction is to continue growing its North American market share in chilled juices, broaden its product mix, expand its presence in attractive global markets and diversify into new distribution channels." Tropicana has also made a strong international push with the acquisition of Dole as almost 20% of revenues come from abroad with increased cheaper production capabilities overseas (China). Furthermore, Tropicana has restructured its operations since its purchase of Dole in 1995. This cost improvement makes Tropicana perhaps the best platform to wring big savings out of Nantucket Nectars. Tropicana also could help the cost structure of Nantucket Nectars by having the strongest buyer power in the juice business (e.g. 25% of FLA. orange crop each year). The founders knew the Ocean Spray senior management from industry conferences and believed that there was a good match of culture. Ocean Spray was private which would allow Nantucket Nectars to operate in a similar fashion: less disclosure, less hassle, and less short-term pressure to hit earnings. The founders also knew that Ocean Spray generated a good internal cash flow which could be used to fund Nantucket Nectar growth. They also knew that Nantucket Nectars might be able to exploit Ocean Spray's loss of Pepsi distribution which might cause them to bid aggressively. Ocean Spray is the world's largest purchaser of non-orange fruit juice, especially berries, tropicals and other exotics. Lastly, Ocean Spray maintained a network of five captive bottling plants plus several long term arrangements with bottlers giving secure, national manufacturing coverage at advantageous cost and quality control. The founders were worried by the loss of Pepsi distribution Industry experts believed that the distribution agreement would terminate in May, 1998 with 50% of current single- serve distribution handled by Pepsi-owned bottlers (approx. $100MM) with another $100MM handled by Pepsi franchisees. Thus, Ocean Spray could lose as much as $200 million in sales (from a base of $1.05 billion) if they could not find a good distributor or could not distribute effectively themselves. Ocean Spray, however, maintained strong power on the grocery shelves, especially in the Northeast Pepsi seems more prepared to take risks with new products in the New Age segment. Pepsi recently terminated its distribution arrangement with Ocean Spray which will take effect sometime in early 1998. Many industry insiders believe that Pepsi entered into this distribution arrangement to learn as much as possible about single serve New Age beverages before entering the market themselves. Skip Carpenter, a Donaldson, Lufkin & Jenrette equity analyst, described the action as a move that clearly signals a bold new way in which PepsiCo will compete in the juice segment going forward." In late 1996, Pepsi launched a cold, ready-to-drink sparkling coffee drink with Starbucks coffee called Mazagran. In 1995, Pepsi also launched Aquafina, a bottled water drink. One major concern for the founders was that Pepsi has a history of downscaling the quality of products, such as Lipton Brisk Tea, in order to achieve higher volume. Pepsi 7 DLJ Research report, July 14, 1997. Donaldson, Lufkin & Jenrette Beverage Industry Report: Skip Carpenter; July 14, 1997. 17 898-171 Nantucket Nectars Potential Bidder Triarc (Snapple and Mistic) Cadbury (Schweppes Ginger Ale) Starbucks Strategic Match The founders believed that Triarc provided the best platform to grow the Nantucket Nectars business the most over the next two years. Through ownership of Snapple, RC Cola and Mistic, Triarc has immediate access to a national single-serve network to push the Nantucket Nectar product One concem was that Triarc would want to replace many of Nantucket Nectar's distributors because of redundancy. While the written contracts with the distributors were favorable concering termination without too much cost, Nantucket Nectars worried about reprise from distributors (similar to what happened to Quaker Oats after they bought Snapple, which created the term "Snappleization"). Cadbury owns Schweppes Ginger Ale, 7 Up and Dr. Pepper. The firm has come under pressure in the past two years to improve its management team, set up a succession plan and to reduce its dependence on the Cadbury family. Stagnant sales in the carbonated soda segments, a vulnerable production structure and perceived lack of direction have created takeover rumors. The sheer size of Cadbury makes a takeover unlikely. The production strategy is to use an assorted group of independent bottlers as well as long-term agreements with Coke and Pepsi. While there have been no public indications to date, Cadbury might have plans to diversify its beverage portfolio away from slow-growing carbonated sodas toward the faster growing New Age beverage segments. While Cadbury has deep pockets to operate a New Age beverage company appropriately and for strategic reasons might decide to bid aggressively for Nantucket, there current company strategy does not create much operating improvements or increased distribution strength. Nantucket Nectars had recently consummated an agreement with Starbucks calling for all Starbucks coffee shops to carry the Nantucket Nectar product. While Starbucks was clearly not in the New Age beverage business, Howard Schultz was considered to understand the tastes and trends of the new generation. Throughout the negotiations with Starbucks, Schultz expressed that he very much liked the Nantucket Nectars brand and that maybe there was something more which could be done between these two companies. Welch's was very similar to Ocean Spray, private with a cooperative of grape farmers as the parent Founded in 1868, the company maintained sales in the $600 million range, with grape frozen concentrate as the company's main product. Welch's rolled out new product lines in 1997: a shelf-stable concentrate that did not require freezing and a full complomont of single corvo, 16 ounce produot. Flavoro included white grapo poach, apple cranberry, guava peach, apple, watermelon strawberry, strawberry kiwi, fruit punch, pink grapefruit, tropical punch, apple orange pineapple and white grape raspberry Concerning product innovation, Welch's has maintained a strong philosophy of reacting to the marketplace. CEO Dan Dillon described corporate strategy: "The whole industry seemed to be going in one direction, with faddish kinds of products. We have gone in a different direction, by giving the consumer products that have got substance to them. With our grape-based items, that means providing a very distinct, robust-tasting product." The Nantucket Nectars founders were uncertain about Coca Cola's interest in the New Age beverage market given their lack of success with the Fruitopia product. Coca Cola spent $180 million developing Fruitopia of which $60 million was spent on the 1994 product launch. Coca Cola has demonstrated strong concern in the past about acquiring businesses with smaller margins than their core carbonated soda business. Welch's Coca-Cola 18 898-171 -19 Exhibit 10 Latest Twelve Months Trading Statistics for Selected Comparable Companies ($MM) As of 7131/97: Earnings per Share PVE Multiples Market Market Price Share per Shares Outstanding Market Cap (1997-98) Growth Rate 1998 P/E to Growth CY1997E CapLTM Net Revenue Cap/ Book Value Company CY 1998 CY 1997E CY1998 ROE Food and Beverage Growth Brands $12.88 6.4 $ 82 $0.50 $0.65 26 x 20 x 30% 0.70x 0.5 X 2% 1.1 X Ben & Jery's Boston Beer 9.38 16.2 152 0.35 0.40 27 23 14 1.60 0.8 10 2.9 12.00 8.1 97 1.44 1.65 17 15 15 1.00 1.2 13 2.3 10.00 63.9 639 0.54 0.73 19 14 35 0.40 0.6 13 18 21.13 26.8 566 0.60 1.42 NM 30 NM NM 0.6 1 5.8 Celestial Seasonings Colt Corp Dreyers Ice Cream Robert Mondavi Starbucks Weider Nutrition 46.75 75 349 2.02 2.36 23 20 17 120 1.2 13 3.5 20.47 156.7 3208 0.80 1.10 51 37 38 1.00 3.9 8 75 18.50 82 152 0.74 0.95 25 19 28 0.70 0.7 21 5.7 Mean 26.9 x 225 x 25% 0.9x 1.2x 10.1% 3.8 x 898-171 -20- Exhibit 11 Latest Twelve Months Operating Statistics for Selected Comparable Companies ($MM) Dett/ Latest Twelve Months Latest Twelve Months AIR Inv. Mkt. Margins EBITDA EBIT Enterprise Value Enterprise Value/LTM Revs. EBITDA EBIT Company Revenue EBITDA EBIT Net Gross Net DSO Turns Cap. Food and Beverage Growth Brands Ben & Jerry's 3/97 $165 $11 $3 $2 30% 2% 1% $94 0.57 x 8.7 x 27.6 x 34 6.9 x 34% Boston Beer 6/97 186 13 10 6 50 5 3 168 0.90 12.7 17.1 41 7.0 6 Celestial Sensorings 78 12 10 6 62 16 12 7 101 129 82 10.5 46 4.2 7 Ca Corp. 4/97 1,015 95 59 47 16 9 6 oh 851 0.84 8.9 14.4 45 NA 39 Dreyers Ion Cream 6/97 886 51 22 1 22 6 2 0 857 0.97 16.9 398 36 15.4 44 Robert Mondavi 6/97 301 67 55 28 45 22 18 9 912 3.03 13.6 16.6 60 1 24 Starbucks 3/97 827 117 60 41 53 14 8 5 3,593 30.7 523 9 5.1 5 Weider Nutrition 5/97 219 37 30 17 37 17 14 8 508 2.32 13.7 17.0 58 3.6 11 Wholesome and Hearty Foods 3/97 40 2 1 1 49 4 2 2 57 1.43 37.3 71.4 36 NA 0 Mean: 40.4% 11.3% 7.7 1.7 x 16.7 29.6 x 40.6 6.2 x 18.9% Source: Hambrecht & Quist 898-171 -21- Exhibit 12 Selected Food and Beverage M&A Transactions Net Sales LTM ($ mil.) LTM EBIT ($ mil.) Valuel LTM EBIT NMX Value of Transaction ($ mil.) $ 12 100 61 450 155 35 70 1,100 715 300 1,374 42 140 202 3,823 170 140 3,606 oiiiiiiiiii: 184 Date Announced 08/11/92 08/31/92 09/17/92 11/16/92 11/23/92 03/08/93 03/25/93 07/26/93 07/23/93 09/08/93 09/28/93 10/08/93 11/01/93 04/18/94 05/23/94 07/19/94 08/29/94 09/12/94 10/18/94 11/02/94 11/28/94 01/01/95 01/04/95 01/06/95 06/27/95 11/22/95 12/01/95 02/15/96 04/08/96 05/06/96 06/05/96 07/29/96 08/14/96 09/19/96 11/18/96 12/04/96 03/27/96 05/02/97 05/07/97 05/12/97 8 8 115 Name Lincoln Snack (Sandoz Nutrition) Stella D'Oro Biscuit Co. Famous Amos Chocolate Chip RJR Nabisco Holdings-Ready-to-Eat Isaly Klondike Co. Per Inc.-Whitman's Chocolates M. Polaner Inc. Mother's Cake & Cookies, 7 Other Italgel SpA Kraft General Foods-Ice Cream Freia Marabou Hillside Coffee of California Kraft General Foods-Birds Eye Universal Foods-Frozen Foods Gerber Products Co. Martha White foods (Windmill) Brock Candy Co. Borden Inc. Fantastic Foods Inc. Snapple Beverage Corp. Pace Foods Pet Inc. Dole Food Co-Juice Business Continental Baking (Wonder, etc.) Mistic Beverage Co. Wine World Estates (Nestle S.A.) Millstone Coffee Inc. Earth's Best Inc. Koala Springs International Eagle Snacks Inc. Sunshine Biscuits Cascadian Farms Ralcorp Holdings-Branded Cereal Hansen Juices Inc. Lenders Bagel Bakery Inc. Mother's Cake & Cookie Co. Snapple Beverage Corp. Bumble Bee Seafoods Inc. Campbell Soup-Marie's Salad Kraft Foods-Log Cabin Acquirer Name Business Description Investor Group Produce, whole pre-popped popcorn Nabisco Foods Group Produce breakfast treats President Banking Co. Produce cookies Kraft General Foods Ready-to-eat cereal business Thomas J. Lipton Inc. Produce ice cream Russell Stover Candies Inc. Produce and whole chocolate American Home Products Corp. Produce fruit spreads, spices Specialty Foods (Specialty) Produce cookies, cake, bread Nestle SA Produce ice cream Unilever U.S. Inc. Produce ice cream Jacobs Suchard (KGF) Produce candy and chocolate Gourmet Coffee of America Inc. Produce coffee Dean Foods Co. Produce frozen vegetables ConAgra Inc. Produce frozen foods Sandoz AG Manufacture baby foods and products Pillsbury Co. (Grand Met PLC) Produce flour and cake mixes Brach Acquisition Co. Produce candy Kohlberg Kravis Roberts & Co. Produce dairy prods. snacks Trefoil Investors II LP Manufacture instant soups, grain prod. Quaker Oats Co. Produce, wholesale soft drinks Campbell Soup Co. Produce pickled vegetables Pillsbury Co. (Grand Met PLC) Dairy products, canned foods Seagram Co. Ltd. Produce, wholesale juice beverages Interstate Bakeries Produce bakery products Triarc Cos. Inc. Produce soft drinks Investor Group Produce wine Procter & Gamble Co. Wholesale coffee products H.J. Heinz Co. Produce baby food Nestle Beverage (Nestle USA) Produce beverages, spring water Procter & Gamble Co. Produce nuts, potato chips Keebler (United Biscuits PLC) Produce biscuits and snacks Trefoil natural Foods Produce grapes General Mills Inc. Produce cereals and snack food Fresh Juice Co. Inc. Produce, wholesale juices Kellogg Co. Produce, wholesale bagels President International Inc. Cookies and crackers Triarc Cos. Inc. Produce, wholesale soft drinks International Home Foods Inc. Manufacture canned seafood products Dean Foods Co. Produce salad dressings Aurora Foods Inc. Manufacture maple-flavored syrup Valuel LTM Sales 0.4 x 1.5 0.8 2.0 1.5 0.4 1.1 0.5 1.5 0.6 1.5 1.5 0.6 0.8 3.2 1.2 1.0 0.9 NM 2.4 5.1 2.1 0.9 0.5 0.6 1.7 NM 1.4 NM NM NM NM 1.9 0.7 1.7 NM 0.5 ! ! ! ! * ! 1,703 1,115 3,225 285 1,021 94 350 127 42 217 NM NM NM NM NM NM NM NM NM NM 7.0 NM NM 20.8 NM 17.5 31.4 NM 13.4 26.5 14.9 NM NM NM 8.8 NM NM NM NM NM NM NM NM NM NM NM NM NM NM 40 - 40 570 8 455 130 300 203 NM NM 2.2 220 1.4 x 17.5 x Average Median: 1.2 x 16.2 x 7.0-31.4 x Range: 0.4-5.1 x 898-171 -22 Exhibit 13 Discounted cash Flow Analysis under Standalone Scenario Revenues Growth 1997 $50,026 94.1% 1998 $69,717 30.0% 1999 $93,700 28.0% 2000 $122,981 25.0% 2001 $148,499 15.0% 2002 $174,635 12.0% 66,715 Gross Profit Gross Margin 17.246 34.5% 26,634 38.2% 35,796 38.2% 46,982 38.2% 56,730 38.2% 38.2% EBITDA EBITDA Margin 2,234 4.5% 4,610 6.6% 7,459 8.0% 11,344 9.2% 15,461 10.4% 20,139 11.5% Valuation Discount Rate Discount Rate 11.0 Valuation EBIT Exit Multiple 9.0 X 10.0 X Equity Value $106,877 $117,767 $97,646 $107,614 $89,323 $98,461 $81.806 $90,195 12.0% 14.0% 16.0% 18.0% $128,658 $117,581 $107,598 $98,584 12.0% 14.0% 16.0% 18.0% Terminal Growth Rate 4.0% 6.0% 8.0% Equity Value $74,634 $98,243 $145,460 $56,094 $69,291 $91,286 $43,874 $52,081 $64,391 $35,255 $40,730 $48,394 Discount Rate Sales Exit Multiple 1.4 X Equity Value 1.0 1.8 12.0% 14.0% 16,0% 18.0% $107,960 $104,706 $96.301 $88,709 $153,666 $140,986 $129,559 $119,243 $ 193,303 $177,266 $162,818 $149,777 898-171 -23- Exhibit 13 (continued) Income Statement (000s) Historical Fiscal Years Ended December 31, 1994 1995 1996 Projected Years Ending December 31, 1997 1998 1999 2000 2001 2002 Total Revenue 8,345 15,335 29,493 50,026 69,717 93,700 122,981 148,499 174,635 6,831 11,024 20,511 32,780 43,083 57,904 75,999 91,769 107,920 Cost of Sales Other Expenses/Adjustments Total Cost of Sales 0 57,904 0 75,999 0 91,769 6,831 11,024 20,511 32,780 43,083 107,920 Gross Profit 1,514 4,311 8,982 17,246 26,634 35,796 46,982 56,730 66,715 875 Marketing & Advertising General & Administrative 320 3,290 2,581 5,432 5,601 9.410 9.238 12.785 11,529 16,808 14,069 21,569 15,819 25,450 17,345 29,231 3,344 EBITDA (2,096) 91 969 2,234 4,610 7,459 11,344 15,461 20,139 Amortization and Depreciation 104 137 247 209 331 495 710 763 947 EBIT (2.199) (45) 722 2,025 4,279 6,964 10,633 14,698 19,192 0 0 0 337 323 323 323 323 323 Interest Expense Notes Payable Current Maturities Interest Income (Excess Cash) Subordinated Debt 0 0 0 0 0 0 0 0 8.5% 8.5% 5.0% 9.0% 0 0 0 (34) 0 (95) ( 204 (187) (345) 0 (601) 204 (996) 204 0. 0 102 204 204 Total Interest Expense/(Income) 53 139 301 405 432 340 182 (74) (469) Earnings Before Taxes (2,252) (184) 421 1,620 3,847 6.624 10,451 14,772 19,661 Income Tax Expense 39.6% 16 52 641 1.523 2.623 4.139 5,850 7.786 Net Income (Loss) (2.252) (2001 369 978 2.324 4.001 6312 S8 922 S11875 898-171 -24- Exhibit 13 (continued) Balance Sheet (000s) Historical Fiscal Years Ended December 31, 1994 1995 1996 1997 1998 2002 SI39 $349 $109 SO 1,139 772 $38 $0 1,328 1,356 105 115 2,942 ASSETS Current Assets Cash Excess Cash (Plug) Inventories Accounts Receivable Prepaid Expenses Other Current Assets Total Current Assets Property, Plant & Equipment, gross Accumulated Depreciation Property, Plant & Equipment, net S2 SO 4,754 2,063 145 335 7,300 $100 $1,346 5,409 4,382 200 500 11,937 10,772 Projected Fiscal Years Ended December 31, 1999 2000 2001 $187 $246 S297 $5,025 $8,769 $15,260 6,948 9,120 11.012 8,207 13,007 281 307 297 937 1.230 21,586 30,444 41,358 $2,455 6,032 6,106 209 697 15,639 $24,590 12.950 15,296 349 1.746 55,281 145 71 2,235 1.485 322 680 332 (137) 195 (99) 223 (204) 1,030 (410) 620 1,518 (739) 779 2,174 (1.232) 943 3,035 (1,940) 1,096 4,075 (2,701) 1,374 5,297 (3.645) 1,652 477 99 49 85 100 139 187 148 175 Other Assets Goodwill & Intangibles 0 77 $3,263 92 $7,953 89 $12.747 87 $16,644 85 $22,801 123 82 $31,745 $2,557 80 $42,961 78 $57,186 LIABILITIES & EQUITY & Current Liabilities Notes Payable Accounts Payable Accrued Expenses Current Maturities Capital Lease Obligations Total Current Liabilities 1,438 1,078 382 0 4,130 2,157 428 1,303 667 270 0 0 2,240 3,800 3,442 950 3,800 4,524 1,325 0 3,800 6,080 1,780 0 3,800 7,980 2,337 0 3,800 9,636 2,821 0 3,800 11,332 3,318 0 0 0 16 0 0 0 0 0 47 6,762 0 11,660 2,914 8,192 9,648 14,116 16,257 18,449 SI 0 . 0 0 0 0 0 0 0 Capital Lease Obligation Other Debt Subordinated Debt 0 0 0 176 176 176 176 2,094 176 2,094 176 2,094 0 0 0 2,094 2,094 2,094 Total Long Term Debt SI 0 0 2,270 2.270 2,270 2,270 2,270 2,270 0 0 22 184 300 418 562 738 891 1,048 Other Long Term Liabilities Excess Debt (Plug) ) Total Liabilities 0 0 0 0 0 0 0 0 0 2,292 2,935 6,946 10,762 12,336 14,492 17,124 19,417 21,767 1 1 1 1 1 1 1 1 Shareholders' Equity Common Stock Additional Paid-In Capital Retained Earnings Total Shareholders' Equity Total Liabilities & Equity & 2,282 (2,019) 265 2,282 (1,956) 328 2,282 (1.277) 1,006 2.282 (299) 1.985 2,282 2,025 4.308 2.282 6,025 8,309 2,282 12,338 14,622 2,282 21.260 23,544 1 2.282 33,135 35,419 $57,186 $2,557 S3,263 $7,953 $12,747 $16,644 $22,801 $31.745 S42,961 898-171 -25- Exhibit 13 (continued) Statement of Cash Flows (000s) Fiscal Year Ended Projected Years Ending December 31, 1998 1999 2000 1994 1995 1996 1997 2001 2002 Cash Flow from operating activities Net income (loss) the (2.252) (200) 369 978 2,324 4,001 6,312 8.922 11.875 104 137 247 331 495 710 763 Adjustments made to reconcile net income (loss) to net cash used by operating activities Depreciation and amortization Deferred Taxes Changes in operating assets and liabilities: Net assets available for sale Accounts Receivable 209 0 0 0 0 0 0 0 0 0 0 0 0 0 0 (1725) (623) (2235) (584) (189) Inventory (1892) (707) (3426) (41) (220) 1079 0 (2319) (655) (55) (165) 1285 () (2101) (917) (72) ( (240) 1556 (9) (197) 1082 (2565) (2171) (26) (293) 1900 (45) 10 (255) 1656 411 112 522 los derella 374 456 556 485 46 162 (2490) ********** # 176 Prepaid expenses Other current assets . Accounts Payable Accrued Expenses Other Non-Current Liabilities - Net cash used by operations Cash flows from investing activities Net additions to property and equipment Proceeds from extraordinary items Net additions (payments) on capital lease obligations Net additions on LT Assets 118 1675 144 3322 153 7607 (298) (83) 4599 (10) (348) (350) (1039) (488) 0 (656) 0 (861) 0 0 0 (36) 0 0 0 31 (36) (353) (47) (15) (412) 0 (26) (39) ) (527) (48) (704) 64 (796) (1065) 135 2692 (330) 0 0 0 0 0 0 0 0 0 0 0 0 0 0 0 0 (0) 176 0 0 0 0 0 Cash flows from financing activities Increase in notes payable Increase in working capital facility Increase in other debt Increase in subordinated debt Dividend Payments Stock Repurchases Proceeds from issuance of common stock Net cash (used) supplied by financing activities 0 0 2094 0 0 0 0 0 O 0 0 0 0 0 0 0 0 O 0 0 0 0 0 0 0 0 0 87 0 0 O 0 115 2807 0 1939 222 0 0 0 0 1119 111 1995 (71) 1996 (36) 1997 1444 1998 1148 1999 2618 2000 3803 2001 6542 2002 9382 Total change in cash Cash at the begining of period 109 38 2 1446 2594 5213 9015 15557 Cash at end of period 38 2 1446 2594 5213 9015 15557 24939 898-171 -26- Exhibit 13 (continued) Discounted Cash Flows (000s) CASH FLOW FORECASTS 1997 1998 2001 2002 Historical 1995 $ 15,335 S (45) 1996 29,493 Projected Years Ending 1999 2000 93,700 $ 122,981 S 6,964 $ 50,026 s S Total Revenues EBITA 69,717 4,279 148,499 14,698 $ 174,635 19,192 722 10,633 2,025 Income Taxes (Benefit) on Unlevered Income ) (18) 286 802 1,695 2,758 4,211 5,820 7,600 Unlevered Net Income (EBIAT) ) (27) 436 1,223 2,585 4,206 6,423 8,878 11,592 137 331 495 710 947 (185) (1,365) Depreciation Working Capital Requirements Capital Expenditures Free Operating Cash Flow 247 (3,232) (315) (2.864) 209 (1,484) ) (350) (402) (1,137) (488) 1,291 (295) 763 (2.283) (1,039) 6,319 (2,658) (861) 3,614 (656) Tales (2,401) (1,222) 8,916 (371) 2,680 Tax Rate 39.6% 39.6% 39.6% 39.6% 39.6% 39.6% 39.6% 39.6%
Step by Step Solution
There are 3 Steps involved in it

Get step-by-step solutions from verified subject matter experts