Answered step by step
Verified Expert Solution
Link Copied!

Question

1 Approved Answer

What would be the units for position vs time in this graph. Next try a Quadratic fit. If this looks appropriate, then click OK and

image text in transcribed

What would be the units for position vs time in this graph.

image text in transcribed
Next try a "Quadratic" fit. If this looks appropriate, then click "OK" and continue. The graph will now show the fit parameters (A, B and C). These quantities have meaning that can be part discerned by dimensional analysis. (You should do so). Curve Fa Fit Type! OMM Gesta Calaisted Cal Weght Colon AT-2 + M +C 4 0.07650 OM -d.607719 Quadrate The Offset Define Function. Delete Function 0.991357 0.0130676 In the example above: A has a value of 0.07650, B has a value of -0.00719, and C has a value of 0.4819, with units of and respectively. A has a value of 0. 07650with units of which means it is a (physical quantity). B has a value of -0. 007719 with units of which means it is a (physical quantity). C has a value of 0.4819 with units of which means it is a (physical quantity). Your values will differ. Record them in the table. A= 1.000 B= 1.000 C= 1.000

Step by Step Solution

There are 3 Steps involved in it

Step: 1

blur-text-image

Get Instant Access to Expert-Tailored Solutions

See step-by-step solutions with expert insights and AI powered tools for academic success

Step: 2

blur-text-image

Step: 3

blur-text-image

Ace Your Homework with AI

Get the answers you need in no time with our AI-driven, step-by-step assistance

Get Started

Recommended Textbook for

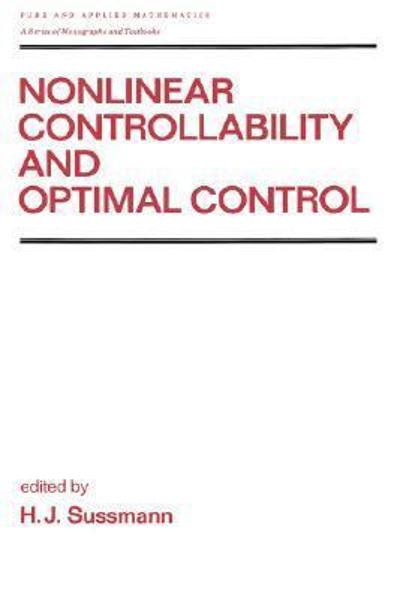
Nonlinear Controllability And Optimal Control

Authors: H. J. Sussmann

1st Edition

1351428330, 9781351428330

More Books

Students also viewed these Mathematics questions

Question

Compare and contrast a trade discount and a quantity discount.

Answered: 1 week ago