Answered step by step
Verified Expert Solution
Question
1 Approved Answer
What would the correct answers be? Montoure Company uses a perpetual inventory system. It entered into the following calendar-year purchases and sales transactions. Units Sold
What would the correct answers be? 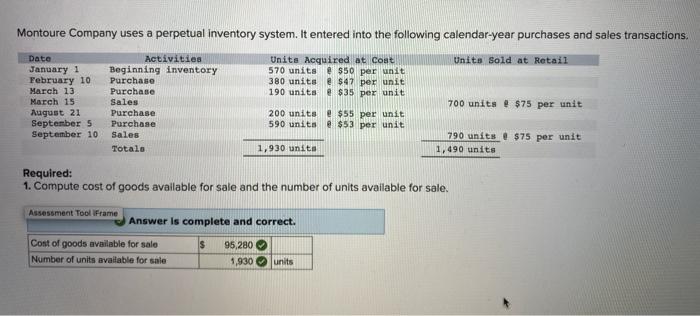
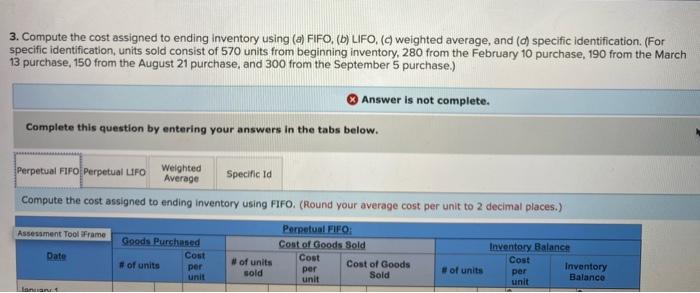
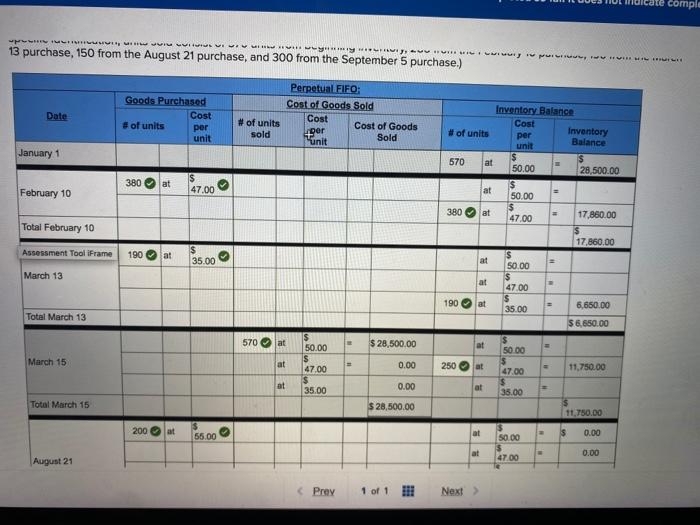
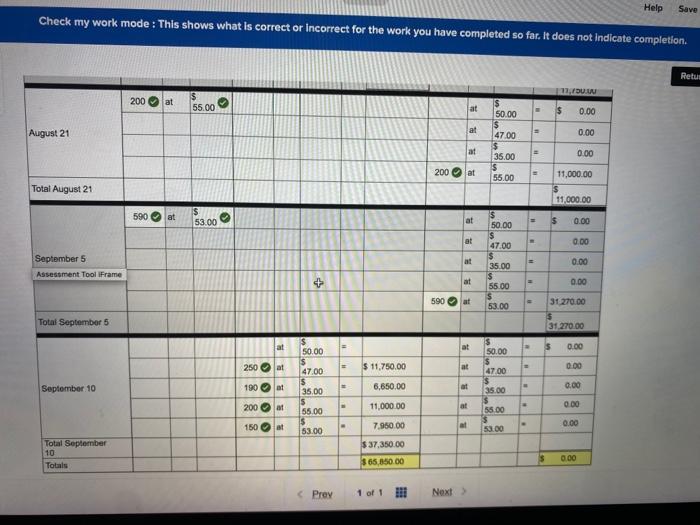
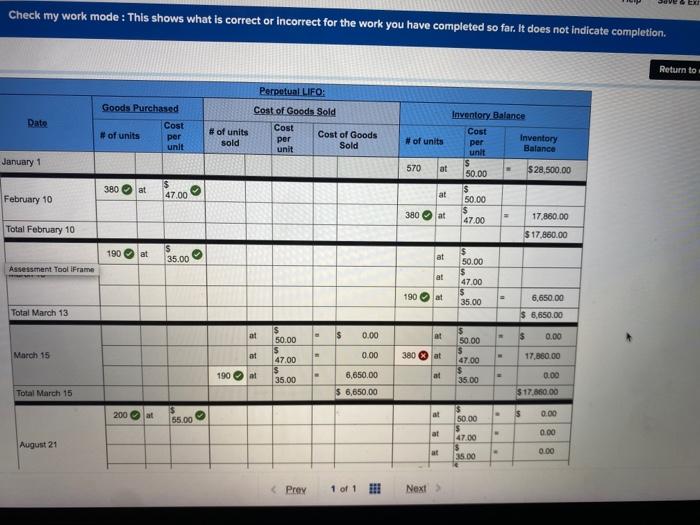
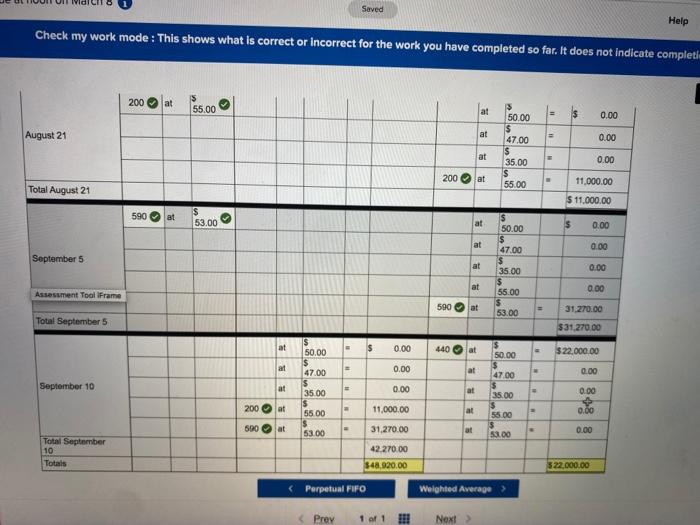
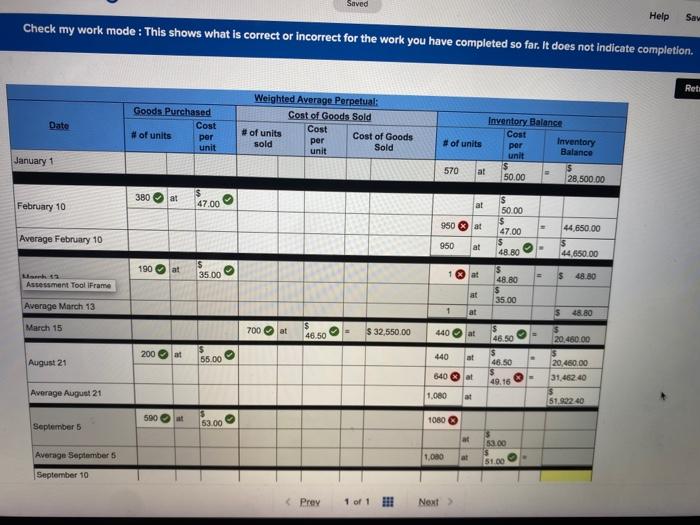
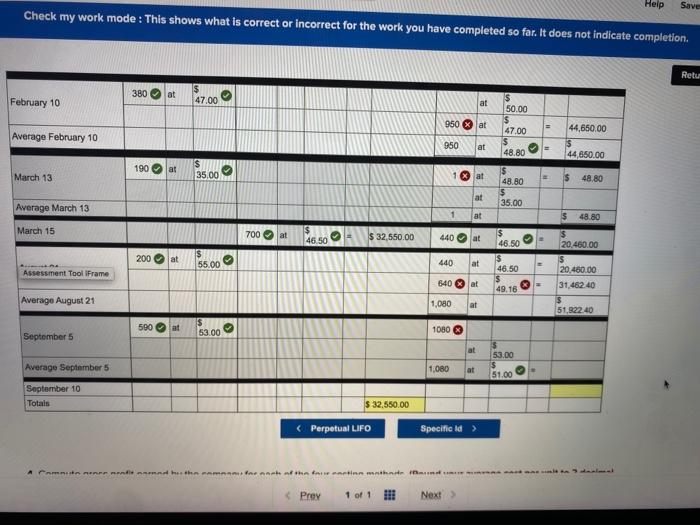
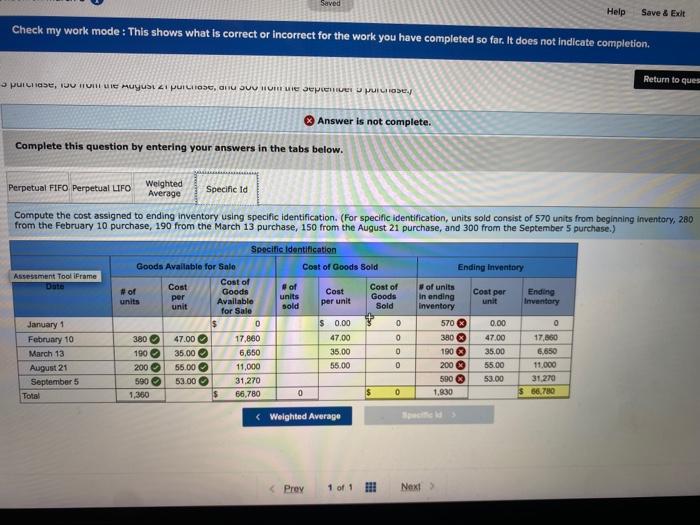
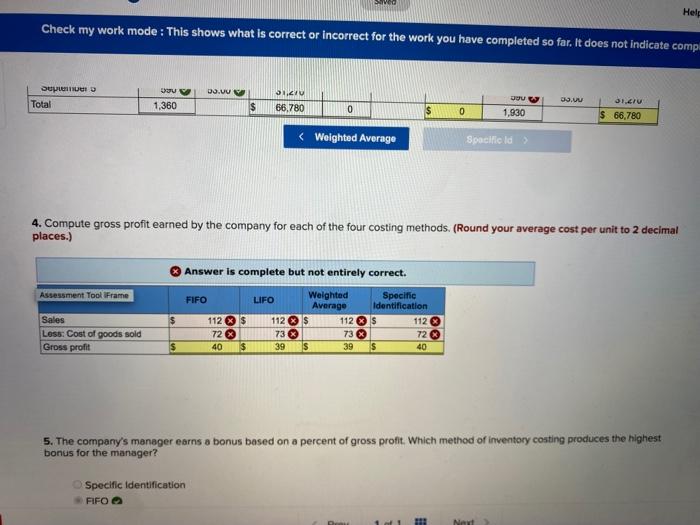
Montoure Company uses a perpetual inventory system. It entered into the following calendar-year purchases and sales transactions. Units Sold at Retail Date January 1 February 10 March 13 March 15 August 21 September 5 September 10 Units Acquired at Cout 570 units $50 per unit 380 units @ $47 per unit 190 units 2 $35 per unit Activities Beginning inventory Purchase Purchase Sales Purchase Purchase Sales Totalo 700 units e$75 per unit 200 units e$55 per unit 590 units e $53 per unit 790 units e $75 per unit 1,490 units 1,930 units Required: 1. Compute cost of goods available for sale and the number of units available for sale. Assessment Tool Frame Answer is complete and correct. S Cost of goods available for sale Number of units available for sale 95 280 1,930 units 3. Compute the cost assigned to ending inventory using (a) FIFO, (D) LIFO ( weighted average, and (d) specific identification. (For specific identification, units sold consist of 570 units from beginning inventory, 280 from the February 10 purchase, 190 from the March 13 purchase, 150 from the August 21 purchase, and 300 from the September 5 purchase.) Answer is not complete. Complete this question by entering your answers in the tabs below. Perpetual Fifo Perpetual ufo Weighted Average Specific la Compute the cost assigned to ending inventory using FIFO. (Round your average cost per unit to 2 decimal places.) Assessment Tool Frame Perpetual FIFO: Goods Purchased Cost of Goods Sold Inventory Balance Date Cost Cost Cost of units # of units per Cost of Goods per Inventory sold #of units unit per unit Sold Balance unit ant Cng US WILL MY WIFI, III III 13 purchase, 150 from the August 21 purchase, and 300 from the September 5 purchase.) Date Goods Purchased Cost of units per unit Perpetual FIFO: Cost of Goods Sold # of units Cost Cost of Goods sold per Sold Inventory Balance Inventory per Balance unit Cost # of units unit January 1 570 at 5 28,500.00 380 at 50.00 $ 50.00 February 10 47.00 at # 380 at 47.00 Total February 10 17,860.00 $ 17,860.00 Assessment Tool iFrame 190 at 35.00 at March 13 at $ 50.00 $ 47.00 $ 35.00 190 at 6,650.00 Total March 13 56.650.00 570 > at $ 28,500.00 at $ 50.00 $ 47.00 50.00 March 15 at 0.00 250 at 47.00 11,750.00 at 35.00 0.00 af = 35.00 Total March 15 $ 28,500.00 $ 11,750.00 200 at 55.00 at $ 0.00 50.00 at 0.00 August 21 47.00 (Prey 1 of 1 !!! Next Help Save Check my work mode : This shows what is correct or incorrect for the work you have completed so far. It does not indicate completion. Retu 117,DU 200 lat 55.00 at $ 50.00 $ 0.00 August 21 at = 0.00 47.00 $ 35.00 at = 0.00 200 at = 55.00 3 Total August 21 11,000.00 $ 11,000.00 590 at 53.00 at = $ 0.00 50.00 0.00 = 0.00 September 5 Assessment Tool Frame 47.00 $ 35.00 $ 55.00 $ 53.00 at # 0.00 590 at - 31.270.00 Total September 5 $ 31 270.00 at at $ 0.00 50.00 50.00 $ 11,750.00 at # 0.00 250 1900 47.00 5 35,00 September 10 6,650.00 at 0.00 47.00 $ 35.00 $ 55.00 11,000.00 200 at at . 0.00 55.00 3 7.950.00 150 at at 0.00 53.00 53100 Total September 10 Totals $37.350.00 $ 65,050.00 3 0.00 Prey 1 of 1 HII Next > Check my work mode : This shows what is correct or incorrect for the work you have completed so far. It does not indicate completion. Return to Perpetual LIFO: Cost of Goods Sold Inventory Balance Date Goods Purchased Cost # of units per unit Cost #of units sold Cost per unit Cost of Goods Sold # of units per unit Inventory Balance January 1 570 at $ 28,500.00 380 at > 47.00 February 10 at 50.00 $ 50.00 $ 47.00 380 at 17.880.00 Total February 10 $ 17,860.00 190 > at 35.00 at Assessment Tool Frame at $ 50.00 1$ 47.00 $ 35.00 190 at 6,650.00 $ 6,650.00 Total March 13 at . $ 0.00 $ 50.00 0.00 March 15 50.00 $ 47.00 $ 35.00 0.00 380 lat # E 47.00 17,860.00 . 190 35 00 0.00 6,650.00 $ 6,650.00 Total March 15 $17.660.00 200 at at $ 50.00 5 0.00 55.00 at 0.00 47.00 August 21 35.00 0.00 - Prey 1 of 1 Next > Saved Help Check my work mode : This shows what is correct or incorrect for the work you have completed so far. It does not indicate completi 200 > at 55.00 at 1 $ 0.00 August 21 at = 0.00 at 50.00 $ 47,00 S 35.00 S 55.00 0.00 200 at . 11,000.00 Total August 21 $ 11,000.00 590 at 53.00 at 0.00 at 0.00 September 5 at IS 50.00 $ 47.00 $ 35.00 $ 55.00 $ 53.00 0.00 at 0.00 Assessment Tool Frame 590 at = Total September 5 31.270.00 $31.270.00 at $ 50.00 0.00 440 lat 50.00 $ 22,000.00 at E 0.00 at - 0.00 September 10 at 47.00 $ 35.00 0.00 47.00 $ 35.00 at 0.00 200 at 55.00 11,000.00 at 0.00 55.00 590 at 53.00 31.270.00 at 53.00 0.00 Total September 10 Totals 42 270.00 $48,920.00 522,000.00 Perpetual FIFO Weighted Average 3 Prey 1 of 1 !!! Next Saved Help Sav Check my work mode: This shows what is correct or incorrect for the work you have completed so far. It does not indicate completion. Rets Date Goods Purchased Cost # of units per unit Weighted Average Perpetual: Cost of Goods Sold #of units Cost Cost of Goods sold per unit Sold Inventory Balance Cost # of units por Inventory Balance unit 570 50.00 28,500.00 January 1 380 al February 10 47.00 at s 50.00 $ 47.00 950 % at 44,650.00 Average February 10 950 at 48.80 44.850.00 190 at 35.00 at $ 48.80 = $ $ 48.80 arh Assessment Tool iFrame Average March 13 at at 35.00 $ 48.80 March 15 700 at $ 32,550.00 . 46.50 440 at 46.50 20.450.00 200 at 55.00 > 440 August 21 at 48.50 : 640 at 49.16 20.450.00 31.462.40 $ 51.99240 Average August 21 1.080 at 500 September 53.00 1080 at 53.00 Average September 6 1,080 at 51.00 September 10 44,860.00 190 = - at > March 13 35.00 1 at $ 48.80 $ 48.80 at 35.00 Average March 13 1 at 5 48.80 March 15 700 al $ 46.50 9 $ 32,550.00 440 at $ 200 at 55.00 > 440 at $ 46.50 $ 46.50 $ 49.16 Assessment Tool Frame 20.460.00 $ 20.480.00 31.462.40 $ 51,922.40 840 at = # Average August 21 1,080 at 590 at 53.00 . 1080 September 5 at 53.00 Average September 1,080 at 51.00 September 10 Totals $ 32,550,00 menemhatha Saved Help Save & Exit Check my work mode : This shows what is correct or incorrect for the work you have completed so far. It does not indicate completion. Return to ques Purchase, ID HUHTII Muyusi I PULITOS, CHU SUU HUHTE per puose. Answer is not complete. Complete this question by entering your answers in the tabs below. Perpetual FIFO Perpetual LIFO Weighted Average Specific Id Compute the cost assigned to ending inventory using specific identification. (For specific identification, units sold consist of 570 units from beginning inventory, 280 from the February 10 purchase, 190 from the March 13 purchase, 150 from the August 21 purchase, and 300 from the September 5 purchase.) Specific Identification Goods Avaliable for Sale Cost of Goods Sold Ending Inventory Assessment Tool iFrame Cost of #of Cost #of Goods Cost Cost of of units per units Goods Cost per units Available Ending in ending unit unit sold for Sale Sold Inventory Inventory January 1 D $ 0.00 0 570 0.00 0 February 10 380 47.00 17,860 47.00 0 380 47.00 17,860 March 13 190 35.00 6,650 35,00 0 190 35.00 6,650 August 21 200 55.00 11,000 55.00 0 2003 55.00 11.000 September 5 590 53.00 31.270 590 53.00 31.270 Total 1,360 66,780 0 $ 0 1,830 $ 66780 per unit 0 Weighted Average Proy 1 of 1 Next > Help Check my work mode : This shows what is correct or incorrect for the work you have completed so far. It does not indicate comp D.UU Super Total 512U 66.780 3. 31.IV 1,360 $ 0 $ 0 JOU 1,930 $ 66,780 


Step by Step Solution
There are 3 Steps involved in it
Step: 1

Get Instant Access to Expert-Tailored Solutions
See step-by-step solutions with expert insights and AI powered tools for academic success
Step: 2

Step: 3

Ace Your Homework with AI
Get the answers you need in no time with our AI-driven, step-by-step assistance
Get Started


