Answered step by step
Verified Expert Solution
Question
1 Approved Answer
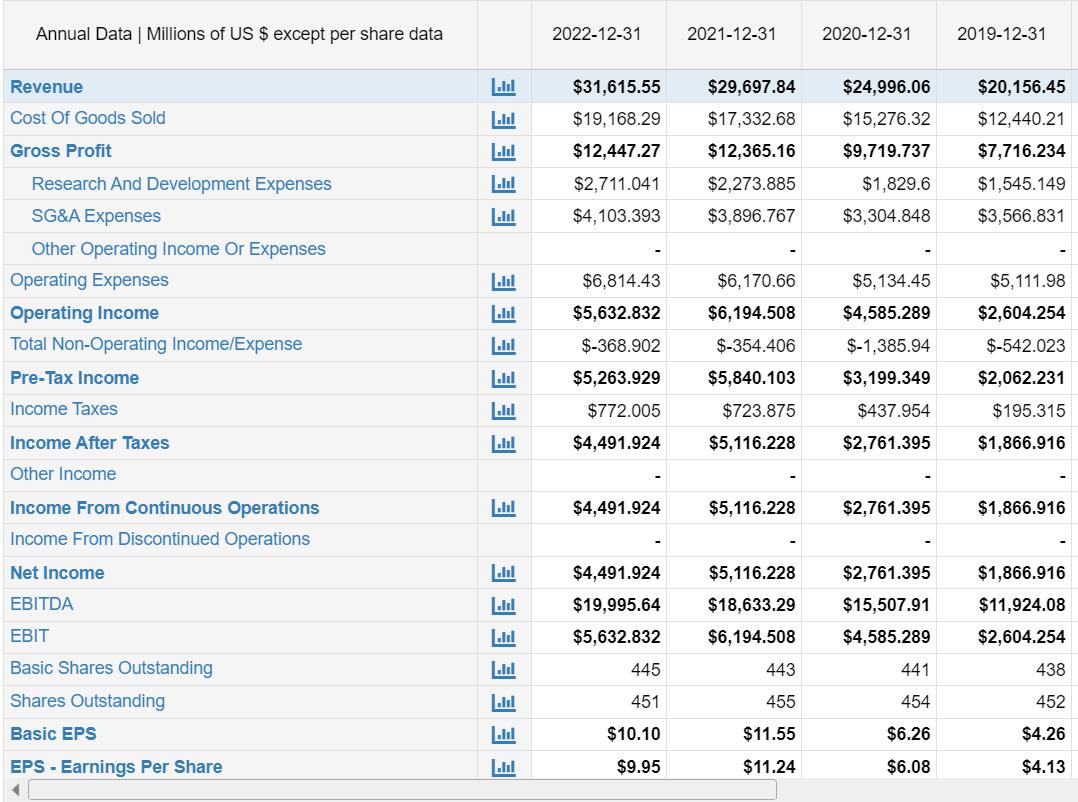
What is their EBITDA as a percentage of Revenue for years ending 2002; 2021; 2022? Annual Data | Millions of US $ except per share
What is their EBITDA as a percentage of Revenue for years ending 2002; 2021; 2022?
Annual Data | Millions of US $ except per share data Revenue Cost Of Goods Sold Gross Profit Research And Development Expenses SG&A Expenses Other Operating Income Or Expenses Operating Expenses Operating Income Total Non-Operating Income/Expense Pre-Tax Income Income Taxes Income After Taxes Other Income Income From Continuous Operations Income From Discontinued Operations Net Income EBITDA EBIT Basic Shares Outstanding Shares Outstanding Basic EPS EPS- Earnings Per Share 4 3333 L L 3 3 3 3 3 3 3 L Lul ..... L 33 2022-12-31 $6,814.43 $5,632.832 $-368.902 $5,263.929 $772.005 $4,491.924 $31,615.55 $29,697.84 $24,996.06 $19,168.29 $17,332.68 $15,276.32 $12,447.27 $12,365.16 $9,719.737 $2,711.041 $2,273.885 $1,829.6 $4,103.393 $3,896.767 $3,304.848 $4,491.924 2021-12-31 445 451 $10.10 $9.95 $6,170.66 $6,194.508 $-354.406 $5,840.103 $723.875 $5,116.228 $5,116.228 $4,491.924 $19,995.64 $18,633.29 $5,632.832 $6,194.508 2020-12-31 443 455 $11.55 $11.24 $5,134.45 $4,585.289 $-1,385.94 $3,199.349 $437.954 $2,761.395 $2,761.395 2019-12-31 441 454 $6.26 $6.08 $20,156.45 $12,440.21 $7,716.234 $1,545.149 $3,566.831 $5,116.228 $2,761.395 $1,866.916 $15,507.91 $11,924.08 $4,585.289 $2,604.254 - $5,111.98 $2,604.254 $-542.023 $2,062.231 $195.315 $1,866.916 $1,866.916 438 452 $4.26 $4.13
Step by Step Solution
★★★★★
3.56 Rating (153 Votes )
There are 3 Steps involved in it
Step: 1
The provided data only includes financial information for years end...
Get Instant Access to Expert-Tailored Solutions
See step-by-step solutions with expert insights and AI powered tools for academic success
Step: 2

Step: 3

Ace Your Homework with AI
Get the answers you need in no time with our AI-driven, step-by-step assistance
Get Started


