Answered step by step
Verified Expert Solution
Question
1 Approved Answer
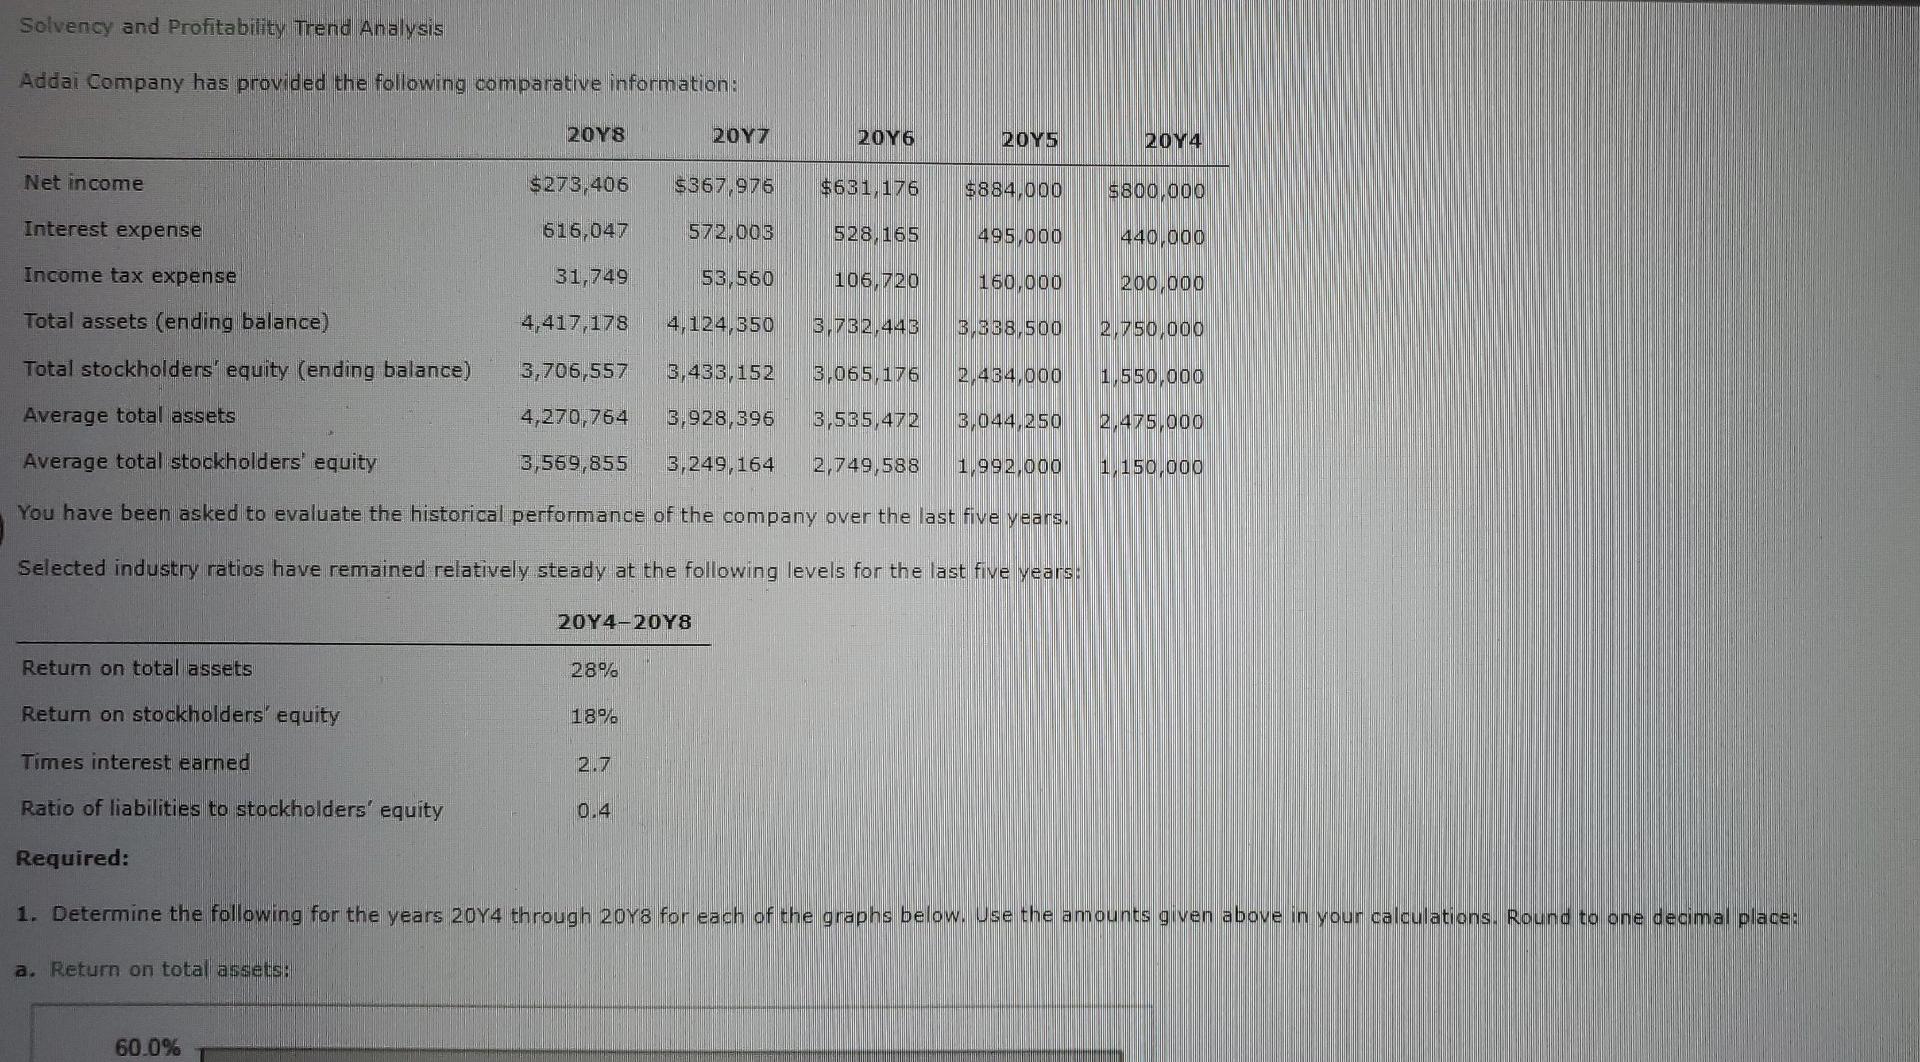
whats the return on total assets for these years. Solvency and Profitability Trend Analysis Addai Company has provided the following comparative information: 2018 2017 2016


whats the return on total assets for these years.
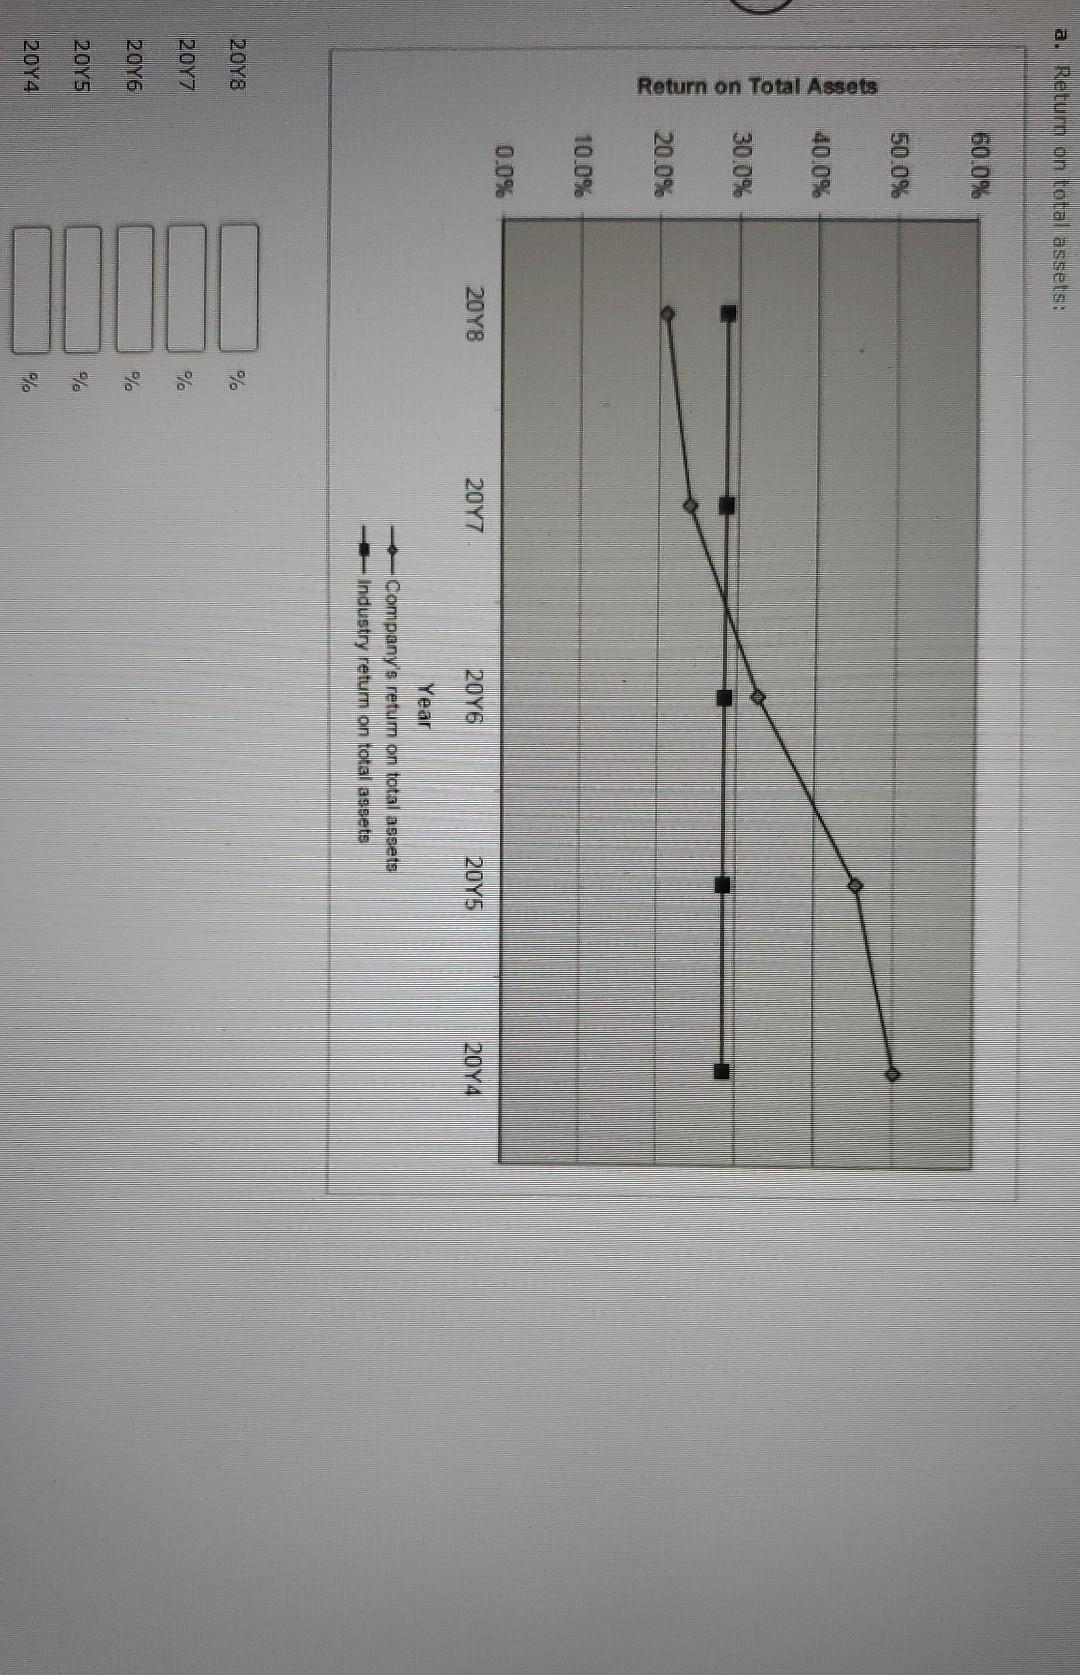
Solvency and Profitability Trend Analysis Addai Company has provided the following comparative information: 2018 2017 2016 20Y5 2014 Net income $273,406 $367.976 $631,176 $884,000 $800,000 Interest expense 616,047 572,005 528,165 495,000 440 000 Income tax expense 31,749 53,560 106,720 160,000 200.000 Total assets (ending balance) 4,417,178 4,124,650 3,732,443 3,338,500 2.750,000 Total stockholders' equity (ending balance) 3,706,557 3,433,152 3,065,176 2,454,000 1,550,000 Average total assets 4,270,764 3,928,396 3,535,472 3,044 250 2,475,000 Average total stockholders equity 3,569,855 3,249,164 2,749,588 1,992,000 1.150.000 You have been asked to evaluate the historical performance of the company over the last five years. Selected industry ratios have remained relatively steady at the following levels for the last five years 20Y420Y8 Return on total assets 28% Return on stockholders' equity 18% Times interest earned 2.7 Ratio of liabilities to stockholders' equity 0.4 Required: 1. Determine the following for the years 2014 through 2048 for each of the graphs below. Use the amounts given above in your calculations. Round to one decimal place: a. Return on total assets: 60.0% a. Return on toba assets 60.0% 50.0% 40.0% Return on Total Assets 30.0% 20.0% - 10.0% 0.0% 2018 2017 2016 2015 2014 Year Company's retum on total assets Industry retum on total assets 2018 %. 2017 % 2016 % 2015 % 2014 PloStep by Step Solution
There are 3 Steps involved in it
Step: 1

Get Instant Access to Expert-Tailored Solutions
See step-by-step solutions with expert insights and AI powered tools for academic success
Step: 2

Step: 3

Ace Your Homework with AI
Get the answers you need in no time with our AI-driven, step-by-step assistance
Get Started


