Answered step by step
Verified Expert Solution
Question
1 Approved Answer
What's the Statistical Hypothesis? These data are per capita numbers of cigarettes smoked (sold) by 43 states and the District of Columbia in 1960 together
What's the Statistical Hypothesis?
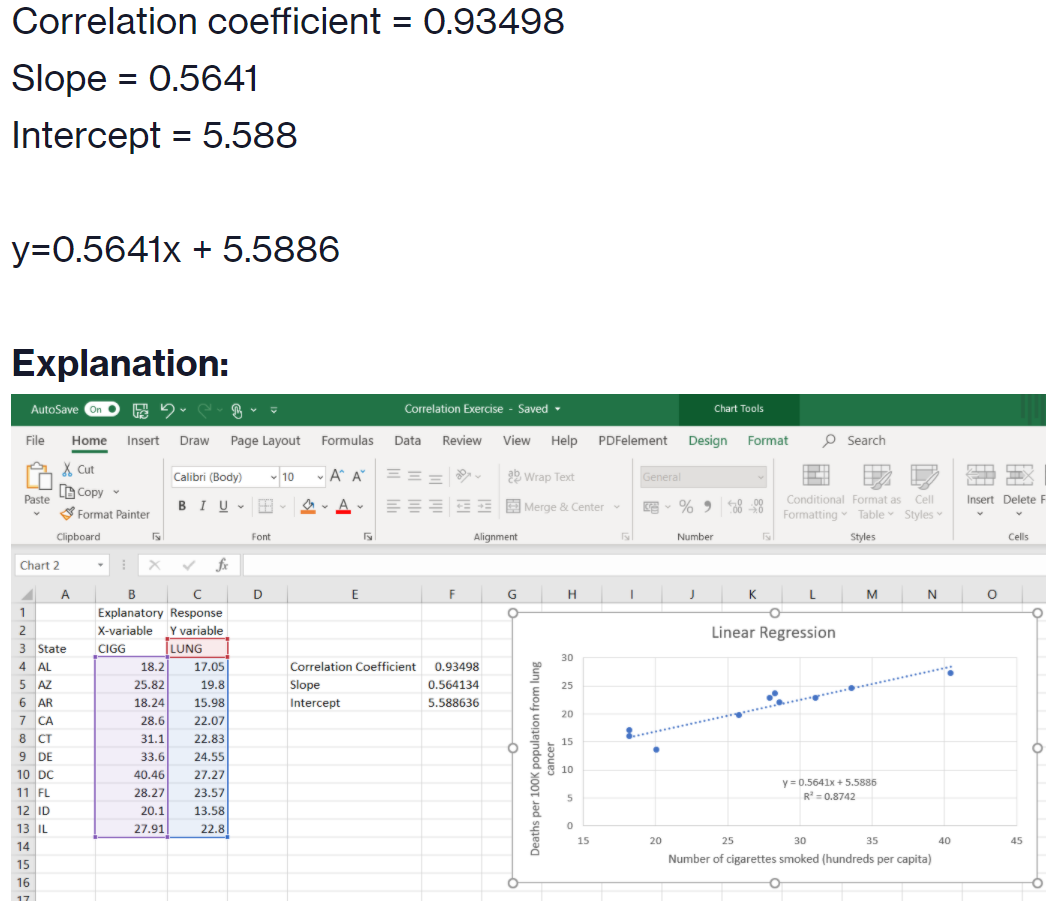
These data are per capita numbers of cigarettes smoked (sold) by 43 states and the District of Columbia in 1960 together with death rates per thousand population from lung cancer.
Variable Names:
- CIG = Number of cigarettes smoked (hundreds per capita)
- LUNG = Deaths per 100K population from lung cancer
Correlation coefficient = 0.93498
Slope = 0.5641
Intercept = 5.588
y=0.5641x + 5.5886

Step by Step Solution
There are 3 Steps involved in it
Step: 1

Get Instant Access to Expert-Tailored Solutions
See step-by-step solutions with expert insights and AI powered tools for academic success
Step: 2

Step: 3

Ace Your Homework with AI
Get the answers you need in no time with our AI-driven, step-by-step assistance
Get Started


