Answered step by step
Verified Expert Solution
Question
1 Approved Answer
What's Your Frequency? Describing Data With Numbers and Graphs You will be choosing a dataset of interest to you. First, visit the dataset link to
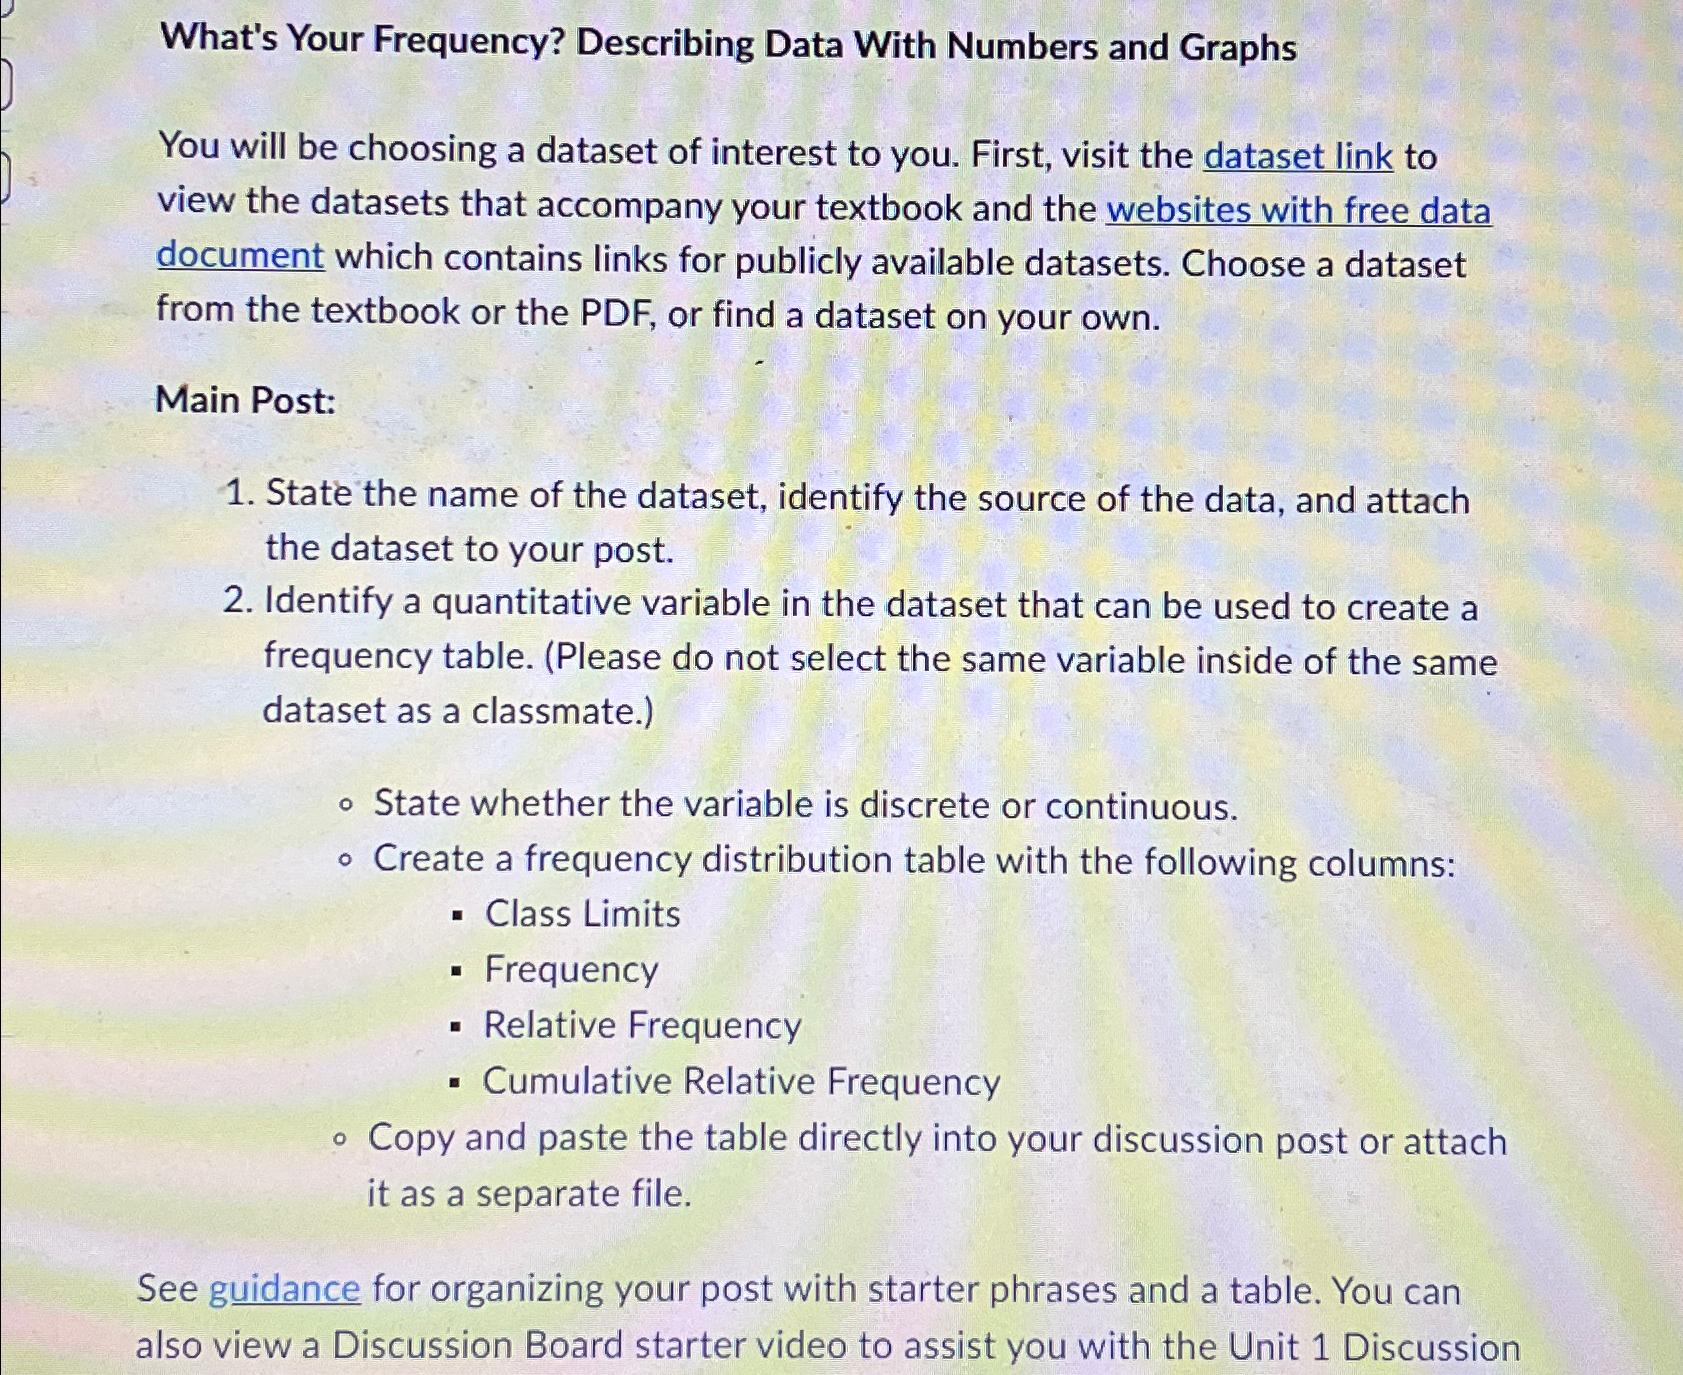
What's Your Frequency? Describing Data With Numbers and Graphs You will be choosing a dataset of interest to you. First, visit the dataset link to view the datasets that accompany your textbook and the websites with free data document which contains links for publicly available datasets. Choose a dataset from the textbook or the PDF or find a dataset on your own. Main Post: State the name of the dataset, identify the source of the data, and attach the dataset to your post. Identify a quantitative variable in the dataset that can be used to create a frequency table. Please do not select the same variable inside of the same dataset as a classmate. State whether the variable is discrete or continuous. Create a frequency distribution table with the following columns: Class Limits Frequency Relative Frequency Cumulative Relative Frequency Copy and paste the table directly into your discussion post or attach it as a separate file. See guidance for organizing your post with starter phrases and a table. You can also view a Discussion Board starter video to assist you with the Unit Discussion 
What's Your Frequency? Describing Data With Numbers and Graphs
You will be choosing a dataset of interest to you. First, visit the dataset link to view the datasets that accompany your textbook and the websites with free data document which contains links for publicly available datasets. Choose a dataset from the textbook or the PDF or find a dataset on your own.
Main Post:
State the name of the dataset, identify the source of the data, and attach the dataset to your post.
Identify a quantitative variable in the dataset that can be used to create a frequency table. Please do not select the same variable inside of the same dataset as a classmate.
State whether the variable is discrete or continuous.
Create a frequency distribution table with the following columns:
Class Limits
Frequency
Relative Frequency
Cumulative Relative Frequency
Copy and paste the table directly into your discussion post or attach it as a separate file.
See guidance for organizing your post with starter phrases and a table. You can also view a Discussion Board starter video to assist you with the Unit Discussion
Step by Step Solution
There are 3 Steps involved in it
Step: 1

Get Instant Access to Expert-Tailored Solutions
See step-by-step solutions with expert insights and AI powered tools for academic success
Step: 2

Step: 3

Ace Your Homework with AI
Get the answers you need in no time with our AI-driven, step-by-step assistance
Get Started


