Answered step by step
Verified Expert Solution
Question
1 Approved Answer
When applied to the 2019 CFL Season, Solver produces the ratings as shown on the left, as well as a Home Field Advantage factor of
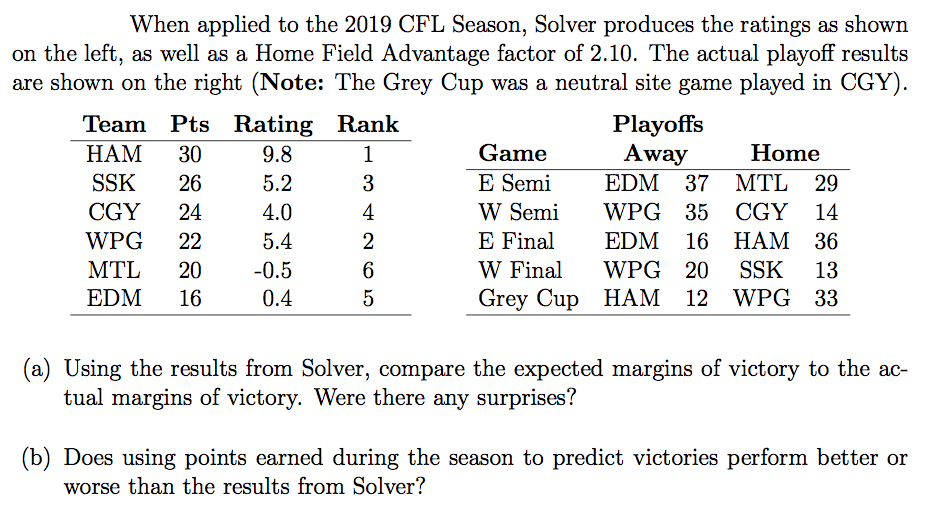
When applied to the 2019 CFL Season, Solver produces the ratings as shown on the left, as well as a Home Field Advantage factor of 2.10. The actual playoff results are shown on the right (Note: The Grey Cup was a neutral site game played in CGY). Team Pts Rating Rank Playoffs HAM 30 9.8 1 Game Away Home SSK 26 5.2 3 E Semi EDM 37 MTL 29 CGY 24 4.0 4 W Semi WPG 35 35 CGY 14 WPG 22 5.4 2 E Final EDM 16 HAM 36 MTL 20 -0.5 6 W Final WPG 20 SSK 13 EDM 16 0.4 5 Grey Cup HAM 12 WPG 33 (a) Using the results from Solver, compare the expected margins of victory to the ac- tual margins of victory. Were there any surprises? (b) Does using points earned during the season to predict victories perform better or worse than the results from Solver? When applied to the 2019 CFL Season, Solver produces the ratings as shown on the left, as well as a Home Field Advantage factor of 2.10. The actual playoff results are shown on the right (Note: The Grey Cup was a neutral site game played in CGY). Team Pts Rating Rank Playoffs HAM 30 9.8 1 Game Away Home SSK 26 5.2 3 E Semi EDM 37 MTL 29 CGY 24 4.0 4 W Semi WPG 35 35 CGY 14 WPG 22 5.4 2 E Final EDM 16 HAM 36 MTL 20 -0.5 6 W Final WPG 20 SSK 13 EDM 16 0.4 5 Grey Cup HAM 12 WPG 33 (a) Using the results from Solver, compare the expected margins of victory to the ac- tual margins of victory. Were there any surprises? (b) Does using points earned during the season to predict victories perform better or worse than the results from Solver
Step by Step Solution
There are 3 Steps involved in it
Step: 1
Get Instant Access to Expert-Tailored Solutions
See step-by-step solutions with expert insights and AI powered tools for academic success
Step: 2
Step: 3
Ace Your Homework with AI
Get the answers you need in no time with our AI-driven, step-by-step assistance
Get Started