

Question
When oil skyrocketed between mid 2006 and 2008, airline companies increased their use of commodity derivates to reduce their exposure to raising jet fuel prices.
When oil skyrocketed between mid 2006 and 2008, airline companies increased their use of commodity derivates to reduce their exposure to raising jet fuel prices. This problem shows the effect of fuel hedging for Southwest.
On December 31st 2007 the COO of Southwest came out with an estimate of expected fuel consumption for the year 2008 of 1,511 million of gallons. On the same day, the market price of jet fuel per gallon was $2.71. The company wanted to hedge its expected fuel consumption over 2008.
Assume that it is now August 20th, 2008. The CFO has to set up the hedge for the next month (8/21 to 9/22). To set up the hedge, the CFO decides to utilize NYMEX Crude Oil futures. Crude Oil Futures trade in units of 1,000 US barrels (42,000 gallons) and they are available for maturities of 30 consecutive months. In addition, the trading of such instruments terminates at the close of business on the third business day prior to the 25th calendar day of the month preceding the delivery month.
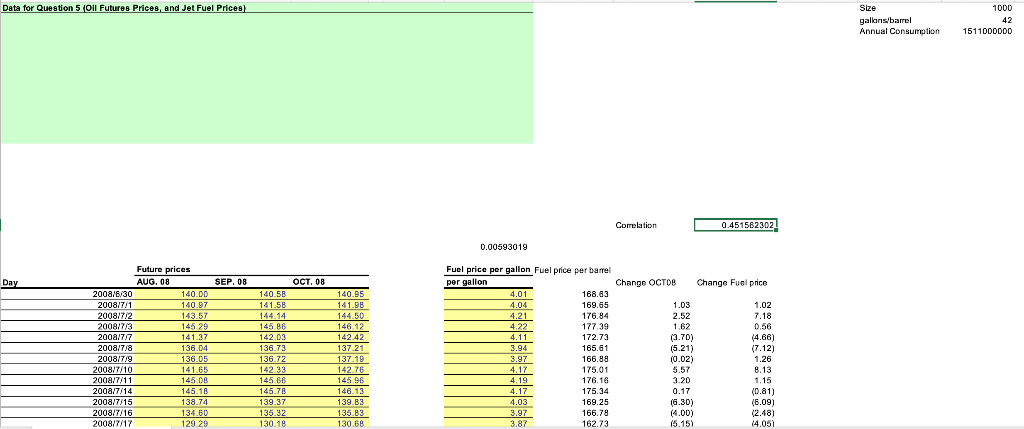
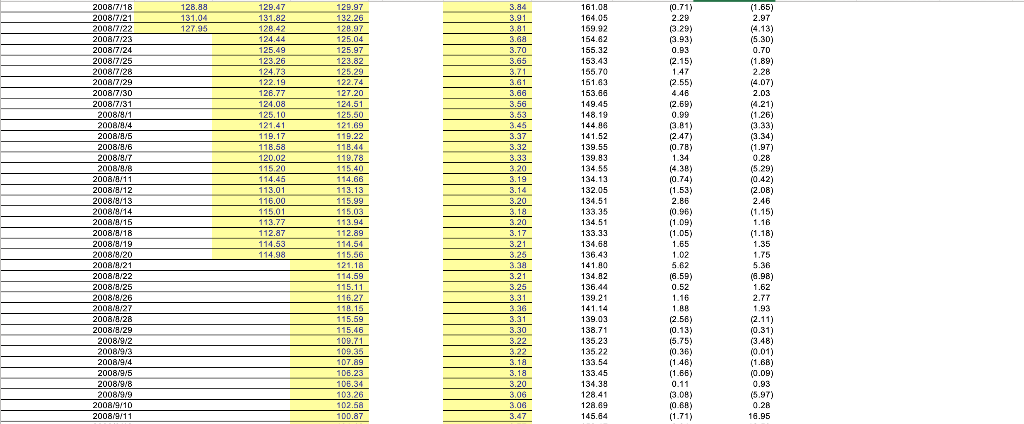
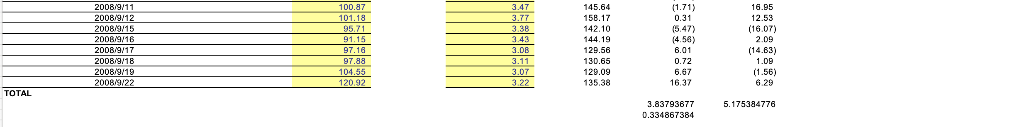
- What strategy would you suggest to the CFO to best hedge the expected fuel consumption over the next month? Tip: if helpful, you can assume that fuel purchase and consumption occurs on the last trading date of each month (e.g., fuel needed for September is purchased and consumed on September 22nd 2008) and that fuel consumption is uniform across months. (4 points)
- Why do you think that the correlation between changes in jet fuel prices and changes in Oct 08 futures prices is not 1? (2 points)
- On September 22nd 2008 the CFO wants to assess the hedging effectiveness of the adopted strategy. What is the P&L (i.e., profit and loss) of the hedging strategy? Was the hedging beneficial? (4 points)
Step by Step Solution
There are 3 Steps involved in it
Step: 1

Get Instant Access to Expert-Tailored Solutions
See step-by-step solutions with expert insights and AI powered tools for academic success
Step: 2

Step: 3
Ace Your Homework with AI
Get the answers you need in no time with our AI-driven, step-by-step assistance
Get Started
Protecting Main Street Measuring The Customer Experience In Financial Services For Business And Public Policy
Authors: Paul C. Lubin
1st Edition
1138864161,1136902546