

Answered step by step
Verified Expert Solution
Question
1 Approved Answer
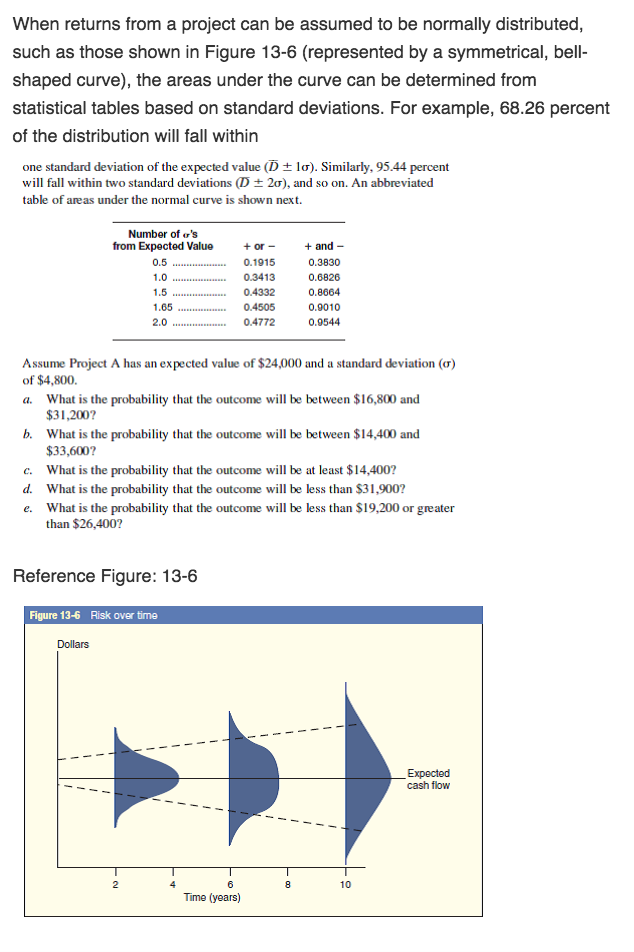
When returns from a project can be assumed to be normally distributed, such as those shown in Figure 13-6 (represented by a symmetrical, bell- shaped
Step by Step Solution
There are 3 Steps involved in it
Step: 1

Get Instant Access to Expert-Tailored Solutions
See step-by-step solutions with expert insights and AI powered tools for academic success
Step: 2

Step: 3
Ace Your Homework with AI
Get the answers you need in no time with our AI-driven, step-by-step assistance
Get Started
Household Finance Adrift In A Sea Of Red Ink Palgrave Macmillan Studies In Banking And Financial Institutions
Authors: D. Chorafas
1st Edition
1137299444, 1137299452, 9781137299451