Answered step by step
Verified Expert Solution
Question
1 Approved Answer
when the reaction mixture turns deep blue. Record your reaction times in Data Table 1. Also record the bath temperature, in C, in Data Table

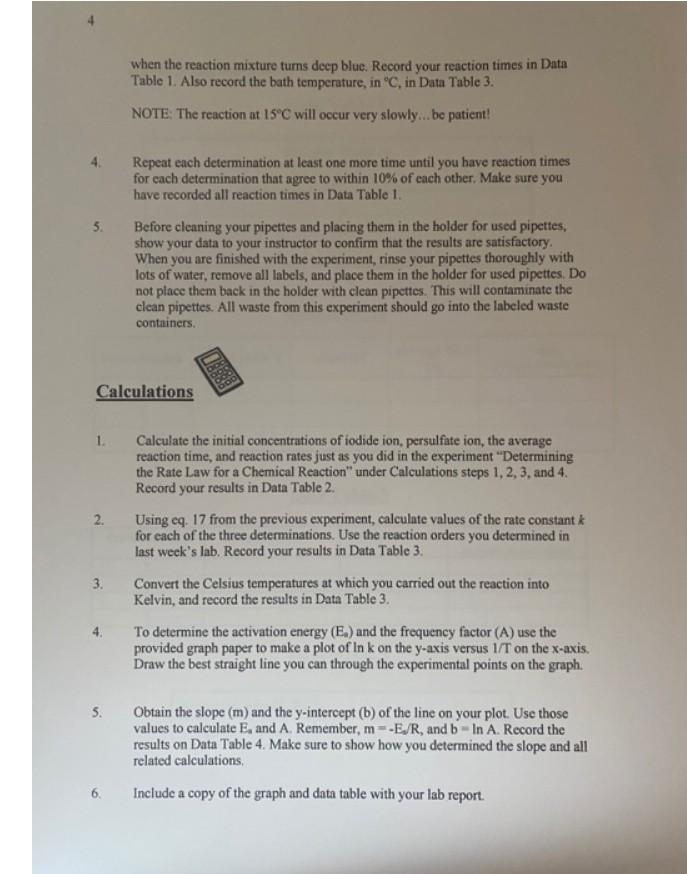
when the reaction mixture turns deep blue. Record your reaction times in Data Table 1. Also record the bath temperature, in C, in Data Table 3. NOTE: The reaction at 15C will occur very slowly ... be patient! 4. Repeat each determination at least one more time until you have reaction times for cach determination that agree to within 10% of each other. Make sure you have recorded all reaction times in Data Table 1. 5. Before cleaning your pipettes and placing them in the holder for used pipettes, show your data to your instructor to confirm that the results are satisfactory. When you are finished with the experiment, rinse your pipettes thoroughly with lots of water, remove all labels, and place them in the holder for used pipettes. Do not place them back in the holder with clean pipettes. This will contaminate the clean pipettes. All waste from this experiment should go into the labeled waste containers. Calculation 1. Calculate the initial concentrations of iodide ion, persulfate ion, the average reaction time, and reaction rates just as you did in the experiment "Determining the Rate Law for a Chemical Reaction" under Calculations steps 1,2,3, and 4. Record your results in Data Table 2. 2. Using eq. 17 from the previous experiment, calculate values of the rate constant k for each of the three determinations. Use the reaction orders you determined in last week's lab. Record your results in Data Table 3. 3. Convert the Celsius temperatures at which you carried out the reaction into Kelvin, and record the results in Data Table 3. 4. To determine the activation energy (Ea) and the frequency factor (A) use the provided graph paper to make a plot of lnk on the y-axis versus 1/T on the x-axis. Draw the best straight line you can through the experimental points on the graph. 5. Obtain the slope (m) and the y-intercept (b) of the line on your plot. Use those values to calculate Ea and A. Remember, m=E2/R, and b=lnA. Record the results on Data Table 4. Make sure to show how you determined the slope and all related calculations, 6. Include a copy of the graph and data table with your lab report. when the reaction mixture turns deep blue. Record your reaction times in Data Table 1. Also record the bath temperature, in C, in Data Table 3. NOTE: The reaction at 15C will occur very slowly ... be patient! 4. Repeat each determination at least one more time until you have reaction times for cach determination that agree to within 10% of each other. Make sure you have recorded all reaction times in Data Table 1. 5. Before cleaning your pipettes and placing them in the holder for used pipettes, show your data to your instructor to confirm that the results are satisfactory. When you are finished with the experiment, rinse your pipettes thoroughly with lots of water, remove all labels, and place them in the holder for used pipettes. Do not place them back in the holder with clean pipettes. This will contaminate the clean pipettes. All waste from this experiment should go into the labeled waste containers. Calculation 1. Calculate the initial concentrations of iodide ion, persulfate ion, the average reaction time, and reaction rates just as you did in the experiment "Determining the Rate Law for a Chemical Reaction" under Calculations steps 1,2,3, and 4. Record your results in Data Table 2. 2. Using eq. 17 from the previous experiment, calculate values of the rate constant k for each of the three determinations. Use the reaction orders you determined in last week's lab. Record your results in Data Table 3. 3. Convert the Celsius temperatures at which you carried out the reaction into Kelvin, and record the results in Data Table 3. 4. To determine the activation energy (Ea) and the frequency factor (A) use the provided graph paper to make a plot of lnk on the y-axis versus 1/T on the x-axis. Draw the best straight line you can through the experimental points on the graph. 5. Obtain the slope (m) and the y-intercept (b) of the line on your plot. Use those values to calculate Ea and A. Remember, m=E2/R, and b=lnA. Record the results on Data Table 4. Make sure to show how you determined the slope and all related calculations, 6. Include a copy of the graph and data table with your lab report
Step by Step Solution
There are 3 Steps involved in it
Step: 1

Get Instant Access to Expert-Tailored Solutions
See step-by-step solutions with expert insights and AI powered tools for academic success
Step: 2

Step: 3

Ace Your Homework with AI
Get the answers you need in no time with our AI-driven, step-by-step assistance
Get Started


