Question
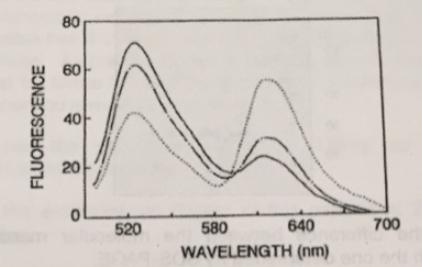
The figure below shows the fluorescence emission spectra of fluorescein (FI) and Texas-Red (TR) when covalently attached to the catalytic (C) or regulatory (R) subunit
The figure below shows the fluorescence emission spectra of fluorescein (FI) and Texas-Red (TR) when covalently attached to the catalytic (C) or regulatory (R) subunit of d cAMP-dependent protein kinase (PKI). When the subunits are associated, resonance energy transfer (RET) occurs from FL to TR. The associated from is C2R2. Read the figure legend and provide a possible explanation for the spectral data.

80 60 40 20 520 580 640 700 WAVELENGTH (nm) FLUORESCENCE
Step by Step Solution
3.25 Rating (160 Votes )
There are 3 Steps involved in it
Step: 1
Consider the first peak is raised with respect to fluorescein and second peak with res...
Get Instant Access to Expert-Tailored Solutions
See step-by-step solutions with expert insights and AI powered tools for academic success
Step: 2

Step: 3

Ace Your Homework with AI
Get the answers you need in no time with our AI-driven, step-by-step assistance
Get StartedRecommended Textbook for
Organic Chemistry
Authors: Graham Solomons, Craig Fryhle, Scott Snyder
11th edition
1118133579, 978-1118133576
Students also viewed these Chemistry questions
Question
Answered: 1 week ago
Question
Answered: 1 week ago
Question
Answered: 1 week ago
Question
Answered: 1 week ago
Question
Answered: 1 week ago
Question
Answered: 1 week ago
Question
Answered: 1 week ago
Question
Answered: 1 week ago
Question
Answered: 1 week ago
Question
Answered: 1 week ago
Question
Answered: 1 week ago
Question
Answered: 1 week ago
Question
Answered: 1 week ago
Question
Answered: 1 week ago
Question
Answered: 1 week ago
Question
Answered: 1 week ago
Question
Answered: 1 week ago
Question
Answered: 1 week ago
Question
Answered: 1 week ago
Question
Answered: 1 week ago
Question
Answered: 1 week ago
View Answer in SolutionInn App


