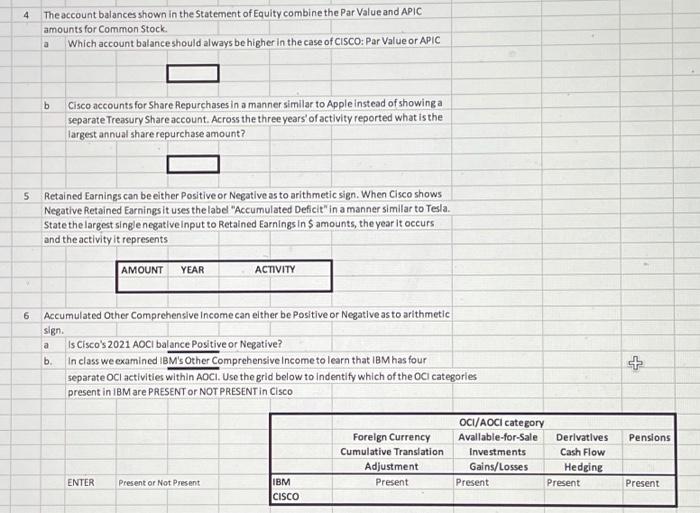
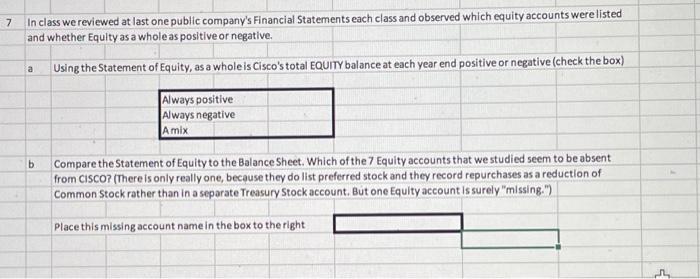
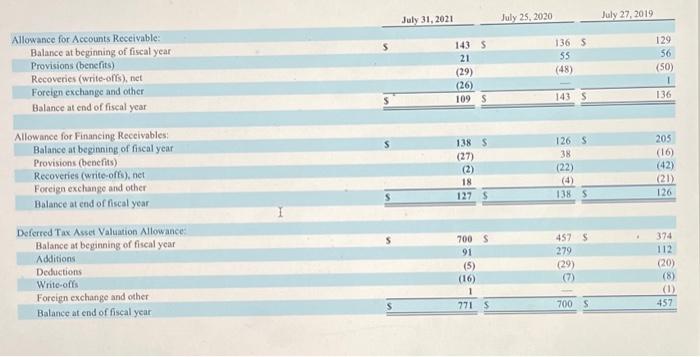
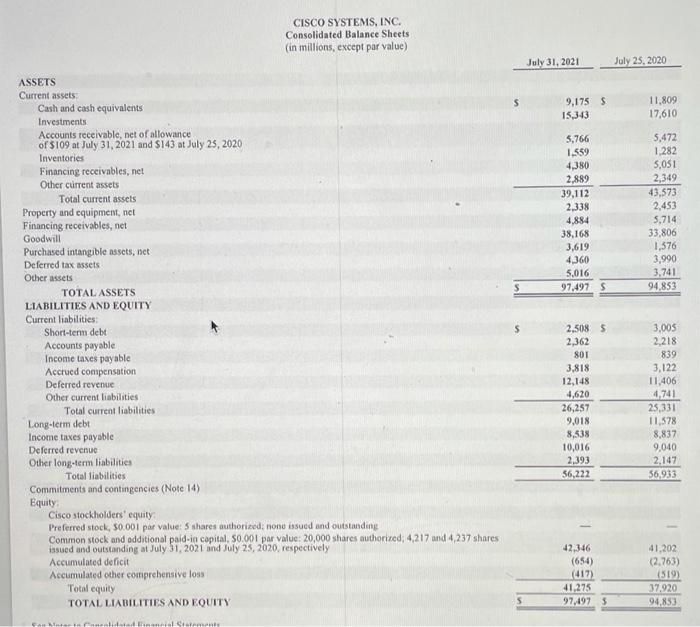
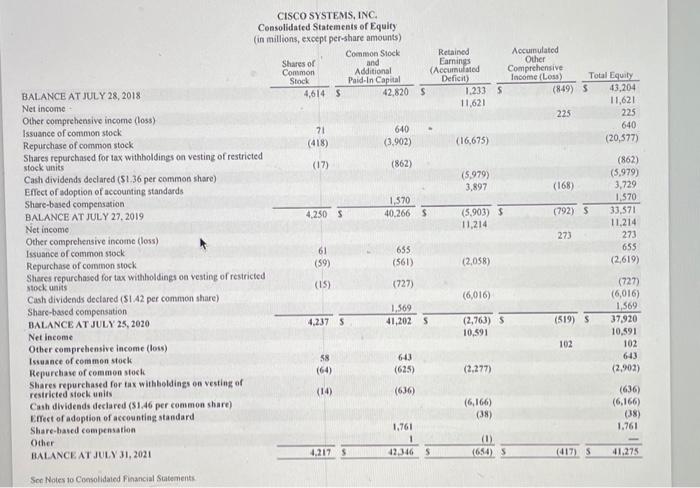
When this exam was mailed to you, the 2020 Annual Report for Cisco Systems was also attached to the email. In addition two excerpts from that 10K was also provided: Cisco's Balance Sheet and Cisco's Statement of Equity Answer the following questions; if boxes are presented use them to provide your answers. 1 The Statement of Equity provides the Ending Balances for all active Equity accounts for 4 years. In the boxes below state the four years. 2 Compare the Statement of Equity to the Balance Sheet. Which "inactive' account presented on Which inactive Equity account on the Balance Sheet is NOT presented in the Statement of Equity? a b Reading the Balance Sheet state briefly why this account is inactive: 3 Look at the first column in the Statement of Equity. It reports the number of Common Shares. Shares can be described as Authorized, issued, and Outstanding, or not depending on their status. Compare this column to the Common Stock LineItem on the balance sheet. Does this column in the Statement of Equity report All common shares or only those Common Shares that are Authorized Issued AND Outstanding? a b For the four year end balances reported, what is the highest number of Common Stock shares reported and the lowest number of such shares and state the year end for which this applies Year # of Shares Highest Lowest 4 The account balances shown in the Statement of Equity combine the Par Value and APIC amounts for Common Stock Which account balance should always be higher in the case of CISCO: Par Value or APIC b Cisco accounts for Share Repurchases in a manner similar to Apple instead of showinga separate Treasury Share account. Across the three years of activity reported what is the largest annual share repurchase amount? 5 Retained Earnings can be either Positive or Negative as to arithmetic sign. When Cisco shows Negative Retained Earnings it uses the label "Accumulated Deficit"in a manner similar to Tesla. State the largest single negative input to Retained Earnings in $ amounts, the year it occurs and the activity it represents AMOUNT YEAR ACTIVITY 6 a Accumulated Other Comprehensive Income can elther be positive or Negative as to arithmetic sign Is Cisco's 2021 AOCI balance Positive or Negative? In class we examined IBM's Other Comprehensive Income to learn that IBM has four separate OC activities within AOCI. Use the grid below to Indentify which of the OC categories present in IBM are PRESENT OR NOT PRESENT in Cisco b + Pens Foreign Currency Cumulative Translation Adjustment Present OCI/AOCI category Avallable-for-Sale Derivatives Investments Cash Flow Gains/Losses Hedging Present Present ENTER Present or Not Present IBM CISCO Present 7 In class we reviewed at last one public company's Financial Statements each class and observed which equity accounts were listed and whether Equity as a whole as positive or negative. a Using the Statement of Equity, as a whole is Cisco's total EQUITY balance at each year end positive or negative (check the box) Always positive Always negative Amix b Compare the Statement of Equity to the Balance Sheet. Which of the 7 Equity accounts that we studied seem to be absent from CISCO? (There is only really one, because they do list preferred stock and they record repurchases as a reduction of Common Stock rather than in a separate Treasury Stock account. But one Equity account is surely "missing.") Place this missing account name in the box to the right 5 July 31, 2021 July 25, 2020 July 27, 2019 143 $ 21 (29) (26) 109 S 136 55 (48) 129 56 (50) 1 136 1435 Allowance for Accounts Receivable: Balance at beginning of fiscal year Provisions (benefits) Recoveries (write-offs), net Foreign exchange and other Balance at end of fiscal year Allowance for Financing Receivables Balance at beginning of fiscal year Provisions (benefits) Recoveries (write-offs), net Foreign exchange and other Balance at end of fiscal year 138 S (27) (2) 18 127 s 126 S 38 (22) (4) 138 5 205 (16) (42) (21) 126 Deferred Tax Asset Valuation Allowance Balance at beginning of fiscal year Additions Deductions Write ots Foreign exchange and other Balance at end of fiscal year 700 S 91 (5) (16) 1 7715 457 279 (29) (7) 374 112 (20) (8) (1) 452 700 S CISCO SYSTEMS, INC. Consolidated Balance Sheets (in millions, except par value) July 31, 2021 July 25, 2020 9,175 $ 15,343 11.809 17.610 5,766 1.559 4.380 2,889 39,112 2.338 4,884 38,168 3,619 4.360 5,016 97,497 $ 5,472 1.282 5,051 2,349 43,573 2,453 3,714 33,806 1,576 3.990 3,741 94,853 ASSETS Current assets Cash and cash equivalents Investments Accounts receivable, net of allowance of 5109 at July 31, 2021 and 143 at July 25, 2020 Inventories Financing receivables, net Other current assets Total current assets Property and equipment, nct Financing receivables, net Goodwill Purchased intangible assets, net Deferred tax assets Other assets TOTAL ASSETS LIABILITIES AND EQUITY Current liabilities Short-term debt Accounts payable Income taxes payable Accrued compensation Deferred revenue Other current liabilities Total current liabilities Long-term debt Income taxes payable Deferred revenue Other long-term liabilities Total liabilities Commitments and contingencies (Note 14) Equity Cisco stockholders' equity Preferred stock, 50.001 par value: 5 shares authorized: none issued and outstanding Common stock and additional paid-in capital, 50.001 par value: 20,000 shares authorized: 4,217 and 4,237 shares issued and outstanding at July 31, 2021 and July 25, 2020, respectively Accumulated deficit Accumulated other comprehensive loss Total equity TOTAL LIABILITIES AND EQUITY 2,508 5 2,362 801 3,818 12,148 4,620 26,257 9,018 8,538 10,016 2.393 36,222 3,005 2,218 839 3,122 11,406 4.741 25,331 11,578 8,837 9,040 2,147 $6,933 1 42.346 (654) (417) 41,275 97,497 5 41,202 (2.763) (519) 37.920 94,850 G C Retained Earnings (Accumulated Deficit) 1.2335 11,621 Accumulated Other Comprehensive Income (Loss) Total Equity (849) S 43,204 11,621 225 225 640 (20,577) (16,675) (862) (5.979) 3,897 (168) (862) (5,979) 3,729 1,570 33,571 11.214 (792) 5 (5,903) $ 11,214 CISCO SYSTEMS, INC. Consolidated Statements of Equity (in millions, except per share amounts) Common Stock Shares or and Common Additional Stock Paid In Capital BALANCE AT JULY 28, 2018 4,614 5 42.820 5 Net income Other comprehensive income (loss) Issuance of common stock 71 640 Repurchase of common stock (418) (3.902) Shares repurchased for tax withholdings on vesting of restricted stock units (17) Cash dividends declared ($1.36 per common share) Effect of adoption of accounting standards Share-based compensation 1,370 BALANCE AT JULY 27, 2019 4.250 S 40.266 $ Net income Other comprehensive income (loss) Issuance of common stock 61 Repurchase of common stock (59) (561) Shares repurchased for tax withholdings on vesting of restricted stock units (15) (727) Cash dividends declared (S142 per common share) Share-based compensation 1,569 BALANCE AT JULY 25, 2020 4.237 S 41,2025 Net Income Other comprehensive Income (los) Issuance of common stock 58 643 Repurchase of common stock (625) Shares repurchased for tax withholdings on vesting of restricted stock units (14) (636) Cash dividends declared (51.46 per common share) Effect of adoption of accounting standard Share-based compensation 1.761 Other BALANCE AT JULY JI, 2021 4.2175 42.346 5 273 273 655 655 (2,619) (2,058) (6,016) (519) S (2,763) 10.591 (727) (6,016) 1,569 37.920 10.591 102 613 (2,902) 102 (2.277) (6,166) (38) (636) (6.166) (38) 1.761 (1) (684) (417) S 41.275 Soe Notes to Consolidated Financial Statements July 25, 2020 July 27, 2019 35,978 $ 13,323 49,301 39,005 12,899 51,904 13,199 4,419 17,618 31,683 14,863 4,375 19.238 32,666 CISCO SYSTEMS, INC. Consolidated Statements of Operations (in millions, except per-share amounts) Yaas Ended July 31, 2021 REVENUE: Product $ 36,014 5 Service 13,804 Total revenge 49.818 COST OF SALES: Product 13,300 Service 4,624 Total cost of sales 17,924 GROSS MARGIN 31,894 OPERATING EXPENSES: Rescarch and development 6,549 Sales and marketing 9,259 General and administrative 2,152 Amortization of purchased intangible assets 215 Restructuring and other charges 886 Total operating expenses 19,061 OPERATING INCOME 12,833 Interest income 618 Interest expense (434) Other income (loss), net 245 Interest and other income (loss), net 429 INCOME BEFORE PROVISION FOR INCOME TAXES 13.262 Provision for income taxes 2,671 NET INCOME 5 10.5915 6,347 9,169 1.925 141 481 18,063 13,620 920 (585) 15 350 13,970 2,756 11,2145 6,577 9.571 1,827 150 322 18,447 14219 1,308 (859) (97) 352 14,571 2.950 11,621 2.515 2.50 S 2.65 $ 2.645 263 2.61 Net income per share Basic Diluted Shares used in per share calculation Basic Diluted 4.222 4,236 4,236 4.254 4.419 4,453 See Notes to Consolidated Financial Statements July 25, 2020 11,2145 July 27, 2019 11,621 336 459 CISCO SYSTEMS, INC. Consolidated Statements of Comprehensive Income (in millions) Year Ended July 31, 2021 Net income 10.5915 Available for sale investments Change in net unrealized gains and losses, net of tax benefit (expense) of 546, 5(84), and S(101) for fiscal 2021, 2020, und 2019, respectively (95) Net (gains) losses reclassified into carnings, net of tax expense benefit of $15, 521, and S6 for fiscal 2021, 2020, and 2019, respectively (38) (133) Cash flow hedging instruments Change in unrealized gains and losses, net of tax benefit (expense) of (4), 50, and so for fiscal 2021, 2020, and 2019, respectively 16 Net (gains) losses reclassified into earnings, net of tax (benefit) expense of $3,50 and 50 for fiscal 2021,2020, and 2019, respectively (11) (21) 315 19 478 (3) (3) 8 Net change in cumulative translation adjustment and actuarial gains and losses, net of tax benefit (expense) of S(2), 5(5), and SIS for fiscal 2021, 2020, and 2019, respectively Other comprehensive income Comprehensive income 230 102 10,693 5 (50) 273 11,4875 (250) 225 11,846 S See Notes to Consolidated Financial Statements