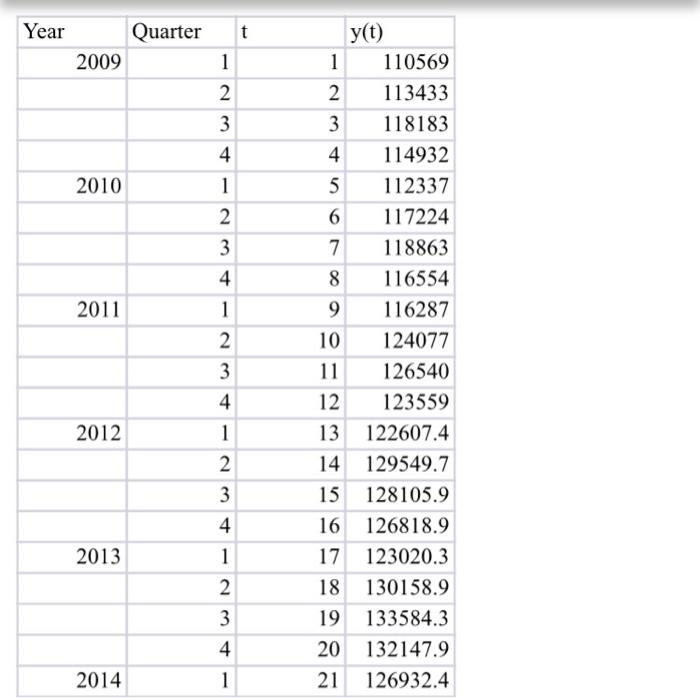
Question
When you divide the original series by the seasonal component, you are then left with the trend component with no seasonality. This adjusted series does
When you divide the original series by the seasonal component, you are then left with the trend component with no seasonality. This adjusted series does not show the regular ups and downs of the original unadjusted data. At this stage, you can come up with a trend line equation.
Regress adjusted seasonality (deseasonality component) to time component. Show the trend line equation using regression for trend-and-season predictive model here and substitute the intercept and slope using the coefficient from the simple linear regression output:
yt = [a + b (t)] SR
Show the regression output here:
(20p.)
Create a plot using adjusted seasonality (deseasonality component) along with linear trend fit and interpret the graph. Show your plot space provided below and do not forget to label x and y axes and adjust the values on the plot using the Figure 1.
(15p.)
Compute a forecast that the series ended on the first quarter with t=21. This means that the next period in the future is the second quarter with t=22.
yt = [a + b (t)] SR =?
where SR is the seasonality ratio for the appropriate quarter corresponding to the value of t.

Step by Step Solution
There are 3 Steps involved in it
Step: 1

Get Instant Access to Expert-Tailored Solutions
See step-by-step solutions with expert insights and AI powered tools for academic success
Step: 2

Step: 3

Ace Your Homework with AI
Get the answers you need in no time with our AI-driven, step-by-step assistance
Get Started


