Answered step by step
Verified Expert Solution
Question
1 Approved Answer
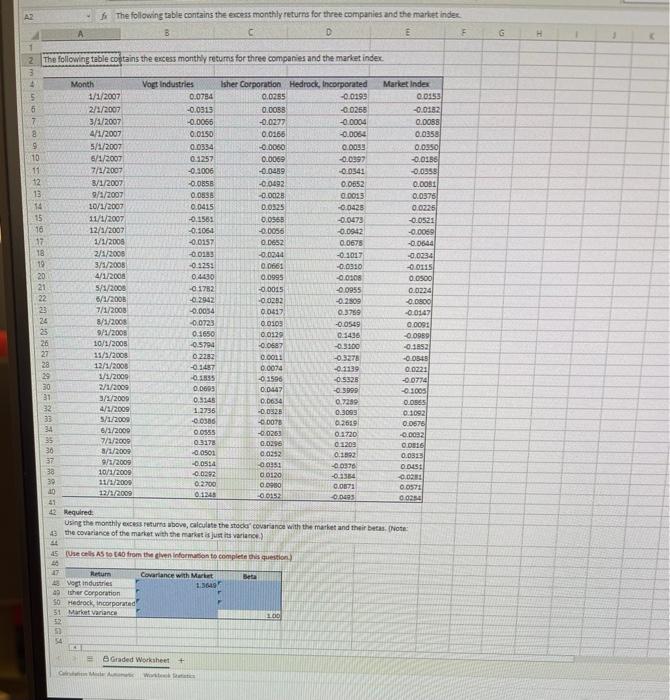
When you solve this. Show the cell formulas used. The following table contains the excess monthly returns for three companies and the market index B
When you solve this. Show the cell formulas used. 
The following table contains the excess monthly returns for three companies and the market index B D G H 2. The following table contains the excess monthly returns for three companies and the market index 6 7 8 9 13 17 20 Month 1/1/2007 2/1/2007 3/1/2007 4/1/2007 5/1/2007 6/1/2007 7/1/2007 8/1/2007 9/1/2007 10/1/2007 11/1/2007 12/4/2007 1/1/2008 2/1/2008 3/1/2008 4/1/2008 5/1/2008 5/1/2005 7/1/2008 8/1/2008 9/1/2008 10/1/2008 11/2/2008 12/1/2008 1/2/2000 2/1/2009 3/2/2000 4/1/2009 5/1/2009 6/1/2000 7/1/2000 3/1/2009 9/3/2009 10/1/2009 11/1/2009 12/1/2009 Vogt Industries Isher Corporation Hedrock, Incorporated 0.0794 0.0255 -0.0195 -0.0313 0.0088 -0.0255 -0.0066 -0.0277 -0.0004 0.0150 0.0166 -0.0064 0.0334 -0.0000 0.0033 0.1257 0.0069 -0.0397 -0.2006 -0.0489 -0.0341 -0.0058 -0.0492 0.0652 0.0838 -0.0028 0.0013 0.0415 0.0525 -0.0425 -0.1583 0.0558 -0.0479 -0.1064 -0.0050 -0.094 -0.0157 0.0652 0.0675 -0.0183 -0.0044 -0.2017 -0.125: 0.0661 -0.0310 0.430 0.0995 -0.0508 01782 -0.0015 -0.0955 -0.2942 -0.0282 -0.2809 0.0034 0.0617 0.3759 -0.0723 0.0103 -0.0549 0.1650 0.0129 0.1436 -0.5794 -0.0687 -0.3300 02282 0.0011 -0.3278 -0.1457 0.0074 03139 0.1855 0 1596 -0.5328 0.0603 0.0147 - 3090 0,3145 0.0634 0.7380 1.2756 -0.0325 0.3093 -0.0300 - 007 0.265 0.0555 -0.0263 0.1720 03178 0.0296 01209 00501 0.0193 0.1992 -0.0514 -0.0351 00370 -0.022 00120 -0.134 0.2700 090 0.01 01245 -0.0152 0043 Q: * * , Market Index 0.0155 -0.0352 0.0088 0.0358 0.0350 -0.0156 -0.0358 0.0031 0.0375 0.0225 -0.0521 -0.0069 -0.0644 -0.0234 -0.0115 0.0500 0.0224 0.0000 -0.01471 0.0091 -0.0950 -0.18 -0.0545 0.0223 -0.0774 -1003 OLOSES 0.1092 0.0676 -0.0032 0.016 0.033 ODST -0.0231 0.0571 00284 22 26 26 32 35 35 42 Required Using the monthly certura above, calculate the stea covariance with the market and their breas. (Note: the covariance of the market with the market is just its variance) GE 45 (Uses AS to 40 from the given information to complete this question) 14 Retum Covariance with Market Beta 43 Vost industries 11369 her Corporation 50 Hedrock, incorporated 51 Market variance 1.00 52 54 Graded Worksheet + GA W The following table contains the excess monthly returns for three companies and the market index B D G H 2. The following table contains the excess monthly returns for three companies and the market index 6 7 8 9 13 17 20 Month 1/1/2007 2/1/2007 3/1/2007 4/1/2007 5/1/2007 6/1/2007 7/1/2007 8/1/2007 9/1/2007 10/1/2007 11/1/2007 12/4/2007 1/1/2008 2/1/2008 3/1/2008 4/1/2008 5/1/2008 5/1/2005 7/1/2008 8/1/2008 9/1/2008 10/1/2008 11/2/2008 12/1/2008 1/2/2000 2/1/2009 3/2/2000 4/1/2009 5/1/2009 6/1/2000 7/1/2000 3/1/2009 9/3/2009 10/1/2009 11/1/2009 12/1/2009 Vogt Industries Isher Corporation Hedrock, Incorporated 0.0794 0.0255 -0.0195 -0.0313 0.0088 -0.0255 -0.0066 -0.0277 -0.0004 0.0150 0.0166 -0.0064 0.0334 -0.0000 0.0033 0.1257 0.0069 -0.0397 -0.2006 -0.0489 -0.0341 -0.0058 -0.0492 0.0652 0.0838 -0.0028 0.0013 0.0415 0.0525 -0.0425 -0.1583 0.0558 -0.0479 -0.1064 -0.0050 -0.094 -0.0157 0.0652 0.0675 -0.0183 -0.0044 -0.2017 -0.125: 0.0661 -0.0310 0.430 0.0995 -0.0508 01782 -0.0015 -0.0955 -0.2942 -0.0282 -0.2809 0.0034 0.0617 0.3759 -0.0723 0.0103 -0.0549 0.1650 0.0129 0.1436 -0.5794 -0.0687 -0.3300 02282 0.0011 -0.3278 -0.1457 0.0074 03139 0.1855 0 1596 -0.5328 0.0603 0.0147 - 3090 0,3145 0.0634 0.7380 1.2756 -0.0325 0.3093 -0.0300 - 007 0.265 0.0555 -0.0263 0.1720 03178 0.0296 01209 00501 0.0193 0.1992 -0.0514 -0.0351 00370 -0.022 00120 -0.134 0.2700 090 0.01 01245 -0.0152 0043 Q: * * , Market Index 0.0155 -0.0352 0.0088 0.0358 0.0350 -0.0156 -0.0358 0.0031 0.0375 0.0225 -0.0521 -0.0069 -0.0644 -0.0234 -0.0115 0.0500 0.0224 0.0000 -0.01471 0.0091 -0.0950 -0.18 -0.0545 0.0223 -0.0774 -1003 OLOSES 0.1092 0.0676 -0.0032 0.016 0.033 ODST -0.0231 0.0571 00284 22 26 26 32 35 35 42 Required Using the monthly certura above, calculate the stea covariance with the market and their breas. (Note: the covariance of the market with the market is just its variance) GE 45 (Uses AS to 40 from the given information to complete this question) 14 Retum Covariance with Market Beta 43 Vost industries 11369 her Corporation 50 Hedrock, incorporated 51 Market variance 1.00 52 54 Graded Worksheet + GA W 
Step by Step Solution
There are 3 Steps involved in it
Step: 1

Get Instant Access to Expert-Tailored Solutions
See step-by-step solutions with expert insights and AI powered tools for academic success
Step: 2

Step: 3

Ace Your Homework with AI
Get the answers you need in no time with our AI-driven, step-by-step assistance
Get Started


