- WHERE would you make changes in order to justify $31 and $56 share price and WHY? You can play with the model assumptions to get to these valuations. Propose two different business plans that would be targeting these two different outcomes. Also remember that higher risk business strategies come with higher expected returns.
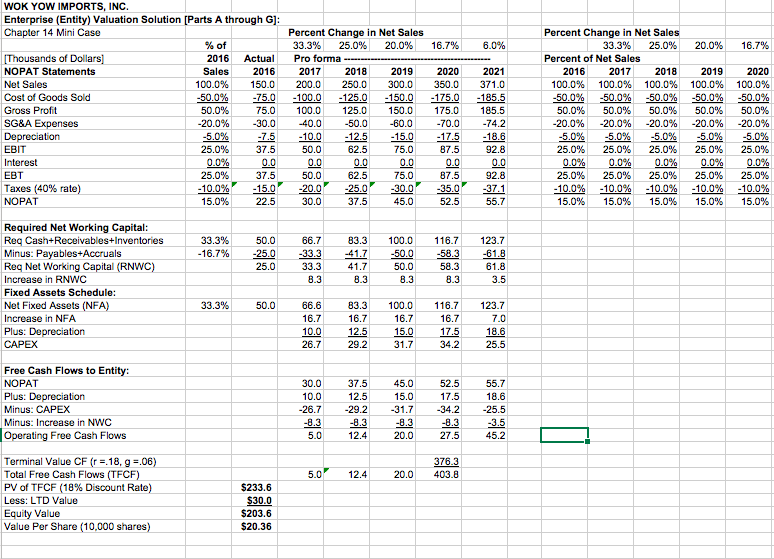
16.7% 6.0% 20.0% 16.7% WOK YOW IMPORTS, INC. Enterprise (Entity) Valuation Solution [Parts A through G]: Chapter 14 Mini Case % of Thousands of Dollars] 2016 Actual NOPAT Statements Sales 2016 Net Sales 100.0% 150.0 Cost of Goods Sold -50.0% -75.0 Gross Profit 50.0% 75.0 SG&A Expenses -20.0% -30.0 Depreciation -5.0% -7.5 EBIT 25.0% 37.5 Interest 0.0% 0.0 EBT 25.0% 37.5 Taxes (40% rate) -10.0% - 15.0 NOPAT 15.0% 22.5 Percent Change in Net Sales 33.3% 25.0% 20.0% Pro forma ----- 2017 2018 2019 200. 0 2 50.0 300.0 -100.0 125.0 -150.0 100.0 125.0 150.0 40.0 -50.0 -60.0 -10.0 -12.5 -15.0 50.0 62.5 75.0 0.0 50.0 625 75.0 20.0 25.0 30.0 30.0 37.5 45.0 2020 350.0 -175.0 175.0 -70.0 -17.5 37.5 0.0 87.5 35.0 52.5 525 2021 371.0 -185.5 185.5 -74.2 -18.6 92.8 0.0 92.8 -37.1 55.7 Percent Change in Net Sales 33.3% 25.0% Percent of Net Sales 2016 2017 2018 100.0% 100.0% 100.0% -50.0% -50.0% -50.0% 50.0% 50.0% 50.0% -20.0% -20.0% -20.0% -5.0% -5.0% -5,0% 25.0% 25.0% 25.0% 0.0% 0.0% 25.0% 25.0% 25.0% -10.0% -10.0% -10.0% 15.0% 15.0% 15.0% 2019 100.0% -50.0% 50.0% -20.0% -5.0% 25.0% 2020 100.0% -50.0% 50.0% -20.0% -5.0% 25.0% 0.0% 25.0% -10.0% 15.0% 0.0 0.0 25.0% -10.0% 15.0% 33.3% -16.7% 50.0 25.0 25.0 66.7 33.3 33.3 8.3 83.3 -41.7 41.7 9.3 100.0 -50.0 50.0 3.3 116.7 -58.3 58.3 3.3 123.7 -61.8 61.8 3.5 Required Net Working Capital: Reg Cash-Receivables+Inventories Minus: Payables Accruals Req Net Working Capital (RNWC) Increase in RNWC Fixed Assets Schedule: Net Fixed Assets (NFA) Increase in NFA Plus: Depreciation CAPEX 33.3% 50.0 66.6 16.7 10.0 26.7 83.3 16.7 12.5 29.2 100.0 16.7 15.0 31.7 116.7 16.7 17.5 34.2 123.7 7.0 18.6 25.5 Free Cash Flows to Entity: NOPAT Plus: Depreciation Minus: CAPEX Minus: Increase in NWC Operating Free Cash Flows 30.0 10.0 -26.7 -8.3 5.0 37.5 12.5 -29.2 45.0 15.0 -31.7 -8.3 20.0 52.5 17.5 -34.2 -8.3 27.5 55.7 18.6 25.5 -3.5 45.2 12.4 5.0 12.4 20.0 376.3 403.8 Terminal Value CF (r = 18, g =.06) Total Free Cash Flows (TFCF) PV of TFCF (18% Discount Rate) Less: LTD Value Equity Value Value Per Share (10,000 shares) $233.6 $30.0 $203.6 $20.36 16.7% 6.0% 20.0% 16.7% WOK YOW IMPORTS, INC. Enterprise (Entity) Valuation Solution [Parts A through G]: Chapter 14 Mini Case % of Thousands of Dollars] 2016 Actual NOPAT Statements Sales 2016 Net Sales 100.0% 150.0 Cost of Goods Sold -50.0% -75.0 Gross Profit 50.0% 75.0 SG&A Expenses -20.0% -30.0 Depreciation -5.0% -7.5 EBIT 25.0% 37.5 Interest 0.0% 0.0 EBT 25.0% 37.5 Taxes (40% rate) -10.0% - 15.0 NOPAT 15.0% 22.5 Percent Change in Net Sales 33.3% 25.0% 20.0% Pro forma ----- 2017 2018 2019 200. 0 2 50.0 300.0 -100.0 125.0 -150.0 100.0 125.0 150.0 40.0 -50.0 -60.0 -10.0 -12.5 -15.0 50.0 62.5 75.0 0.0 50.0 625 75.0 20.0 25.0 30.0 30.0 37.5 45.0 2020 350.0 -175.0 175.0 -70.0 -17.5 37.5 0.0 87.5 35.0 52.5 525 2021 371.0 -185.5 185.5 -74.2 -18.6 92.8 0.0 92.8 -37.1 55.7 Percent Change in Net Sales 33.3% 25.0% Percent of Net Sales 2016 2017 2018 100.0% 100.0% 100.0% -50.0% -50.0% -50.0% 50.0% 50.0% 50.0% -20.0% -20.0% -20.0% -5.0% -5.0% -5,0% 25.0% 25.0% 25.0% 0.0% 0.0% 25.0% 25.0% 25.0% -10.0% -10.0% -10.0% 15.0% 15.0% 15.0% 2019 100.0% -50.0% 50.0% -20.0% -5.0% 25.0% 2020 100.0% -50.0% 50.0% -20.0% -5.0% 25.0% 0.0% 25.0% -10.0% 15.0% 0.0 0.0 25.0% -10.0% 15.0% 33.3% -16.7% 50.0 25.0 25.0 66.7 33.3 33.3 8.3 83.3 -41.7 41.7 9.3 100.0 -50.0 50.0 3.3 116.7 -58.3 58.3 3.3 123.7 -61.8 61.8 3.5 Required Net Working Capital: Reg Cash-Receivables+Inventories Minus: Payables Accruals Req Net Working Capital (RNWC) Increase in RNWC Fixed Assets Schedule: Net Fixed Assets (NFA) Increase in NFA Plus: Depreciation CAPEX 33.3% 50.0 66.6 16.7 10.0 26.7 83.3 16.7 12.5 29.2 100.0 16.7 15.0 31.7 116.7 16.7 17.5 34.2 123.7 7.0 18.6 25.5 Free Cash Flows to Entity: NOPAT Plus: Depreciation Minus: CAPEX Minus: Increase in NWC Operating Free Cash Flows 30.0 10.0 -26.7 -8.3 5.0 37.5 12.5 -29.2 45.0 15.0 -31.7 -8.3 20.0 52.5 17.5 -34.2 -8.3 27.5 55.7 18.6 25.5 -3.5 45.2 12.4 5.0 12.4 20.0 376.3 403.8 Terminal Value CF (r = 18, g =.06) Total Free Cash Flows (TFCF) PV of TFCF (18% Discount Rate) Less: LTD Value Equity Value Value Per Share (10,000 shares) $233.6 $30.0 $203.6 $20.36