

Question
Which DCF model (DDM, FCFE or FCFF) would you use to value the stock? Justify your DCF model choice using historical data on the dividend
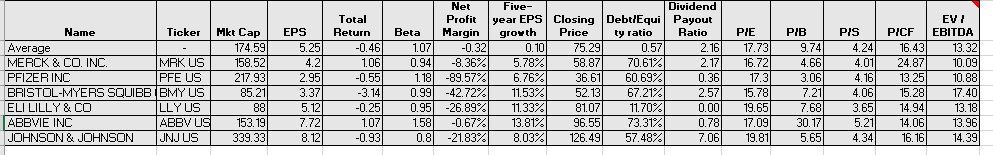
Which DCF model (DDM, FCFE or FCFF) would you use to value the stock? Justify your DCF model choice using historical data on the dividend payout ratio and debt to equity ratio of the stock over the last five-year period.
Assuming the DCF model choice from above), determine the discount rate that you will use to discount the future cash flows. Using resources from Bloomberg, explain in details how you have arrived at this discount rate estimate
Net Profit year Dividend Total Return Beta EV EPS Closing Debt?Equi Payout rovth Price Margingr 1.07 0.34-8.36% 1.18| -89.57% 0.99| -42.72% 0.95-26.89% 1.58| -0.67% 0.81-21.83% Ticker Mkt CapE PS ty ratio Ratio PIE PIB PIS PICF EBITDA 74.59 158.52 217.93 85.21 0.10 5.78 6.76 11.53 11.33% 13.81 8.03 5.25 0.46 1.06 0.55 75.29 58.8770 36.61 60.69 5213 67.21 81.07 96.5573 126,49 57.48 9.74 4.66 3.06 2.16 17.73 2.17 16.72 0.36 2.57 15.78 0.00 19.65 0.78 17.09 7.0619.81 13.32 10.09 10.88 17.40 13.18 13.96 14.39 -0.32 4.24 16.43 4.01 24.87 4.16 13.25 4.06 15.28 3.6514.94 5.21 14.06 4.34 Average 0.57 70.61 MERCK & CO. IND PFIZER INC BRISTOL-MYERS SQUIBB IBMY US ELI LILLY & CO ABBVIE INC JOHNSON & JOHNSON JNJ US MRK US PFE US 2.95 3.37 LLY US ABBy L 153.19 339.33 7.72 8.12 0.25 1.07 0.93 11.70% .31% 7.68 30.17 5.65 16.16 Net Profit year Dividend Total Return Beta EV EPS Closing Debt?Equi Payout rovth Price Margingr 1.07 0.34-8.36% 1.18| -89.57% 0.99| -42.72% 0.95-26.89% 1.58| -0.67% 0.81-21.83% Ticker Mkt CapE PS ty ratio Ratio PIE PIB PIS PICF EBITDA 74.59 158.52 217.93 85.21 0.10 5.78 6.76 11.53 11.33% 13.81 8.03 5.25 0.46 1.06 0.55 75.29 58.8770 36.61 60.69 5213 67.21 81.07 96.5573 126,49 57.48 9.74 4.66 3.06 2.16 17.73 2.17 16.72 0.36 2.57 15.78 0.00 19.65 0.78 17.09 7.0619.81 13.32 10.09 10.88 17.40 13.18 13.96 14.39 -0.32 4.24 16.43 4.01 24.87 4.16 13.25 4.06 15.28 3.6514.94 5.21 14.06 4.34 Average 0.57 70.61 MERCK & CO. IND PFIZER INC BRISTOL-MYERS SQUIBB IBMY US ELI LILLY & CO ABBVIE INC JOHNSON & JOHNSON JNJ US MRK US PFE US 2.95 3.37 LLY US ABBy L 153.19 339.33 7.72 8.12 0.25 1.07 0.93 11.70% .31% 7.68 30.17 5.65 16.16
Step by Step Solution
There are 3 Steps involved in it
Step: 1

Get Instant Access to Expert-Tailored Solutions
See step-by-step solutions with expert insights and AI powered tools for academic success
Step: 2

Step: 3
Ace Your Homework with AI
Get the answers you need in no time with our AI-driven, step-by-step assistance
Get Started
Accounting Comes Alive The Color Accounting Parable
Authors: Mark Robilliard ,Peter Frampton, Chang Chang, Mark Morrow, John Gorman
1st Edition
1450769608, 978-1450769600