Answered step by step
Verified Expert Solution
Question
1 Approved Answer
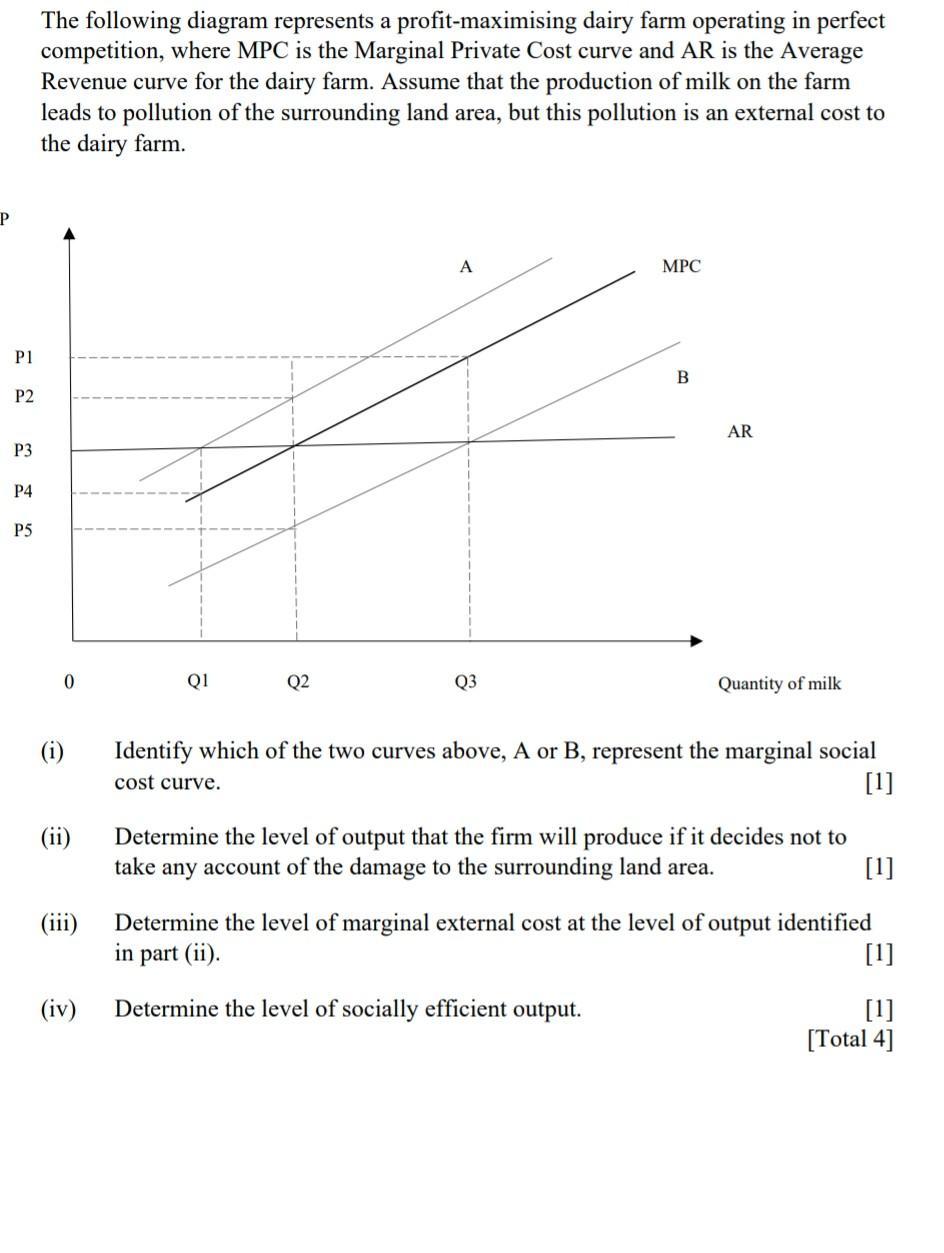
P P1 P2 P3 P4 P5 The following diagram represents a profit-maximising dairy farm operating in perfect competition, where MPC is the Marginal Private

P P1 P2 P3 P4 P5 The following diagram represents a profit-maximising dairy farm operating in perfect competition, where MPC is the Marginal Private Cost curve and AR is the Average Revenue curve for the dairy farm. Assume that the production of milk on the farm leads to pollution of the surrounding land area, but this pollution is an external cost to the dairy farm. (i) 0 (ii) Q1 (111) Q2 A Q3 MPC B AR Quantity of milk Identify which of the two curves above, A or B, represent the marginal social cost curve. [1] Determine the level of output that the firm will produce if it decides not to take any account of the damage to the surrounding land area. [1] Determine the level of marginal external cost at the level of output identified in part (ii). (iv) Determine the level of socially efficient output. [1] [1] [Total 4]
Step by Step Solution
★★★★★
3.37 Rating (150 Votes )
There are 3 Steps involved in it
Step: 1
Question i Curve A represents the marginal social cost curve Margina...
Get Instant Access to Expert-Tailored Solutions
See step-by-step solutions with expert insights and AI powered tools for academic success
Step: 2

Step: 3

Ace Your Homework with AI
Get the answers you need in no time with our AI-driven, step-by-step assistance
Get Started


