

Answered step by step
Verified Expert Solution
Question
1 Approved Answer
Which graph below corresponds to the following hypothesis test? H :p > 5.9, Haip <5.9 Select the correct answer below: O 5.9 5.9
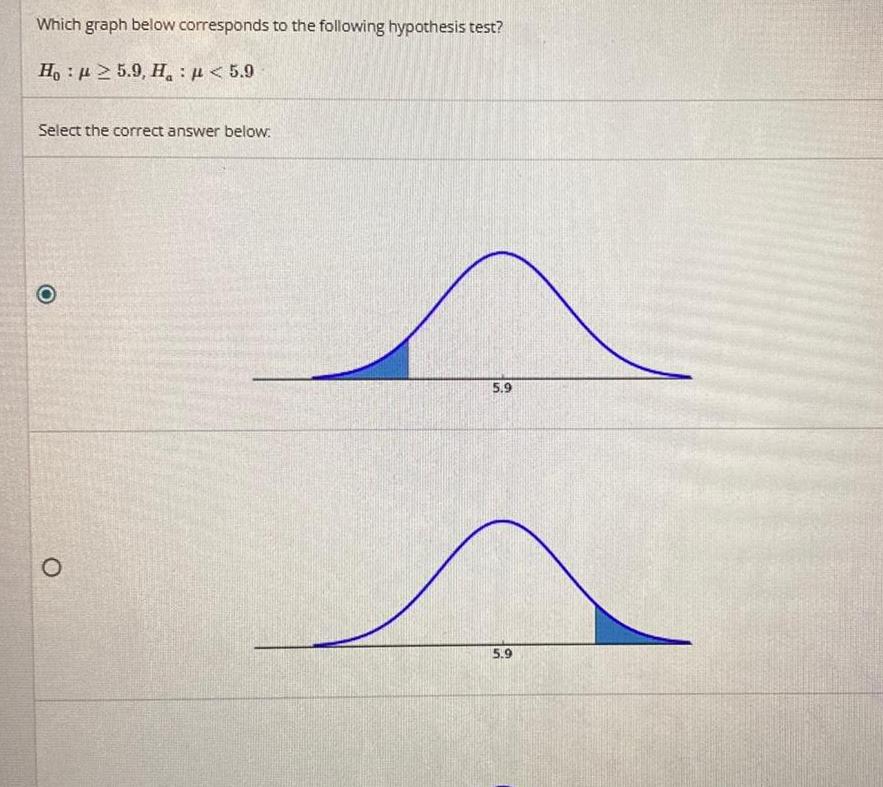
Which graph below corresponds to the following hypothesis test? H :p > 5.9, Haip
Step by Step Solution
There are 3 Steps involved in it
Step: 1

Get Instant Access to Expert-Tailored Solutions
See step-by-step solutions with expert insights and AI powered tools for academic success
Step: 2

Step: 3
Ace Your Homework with AI
Get the answers you need in no time with our AI-driven, step-by-step assistance
Get Started
Forecasting Time Series And Regression
Authors: Bruce L. Bowerman, Richard O'Connell, Anne Koehler
4th Edition
0534409776, 9780534409777