Answered step by step
Verified Expert Solution
Link Copied!

Question

1 Approved Answer

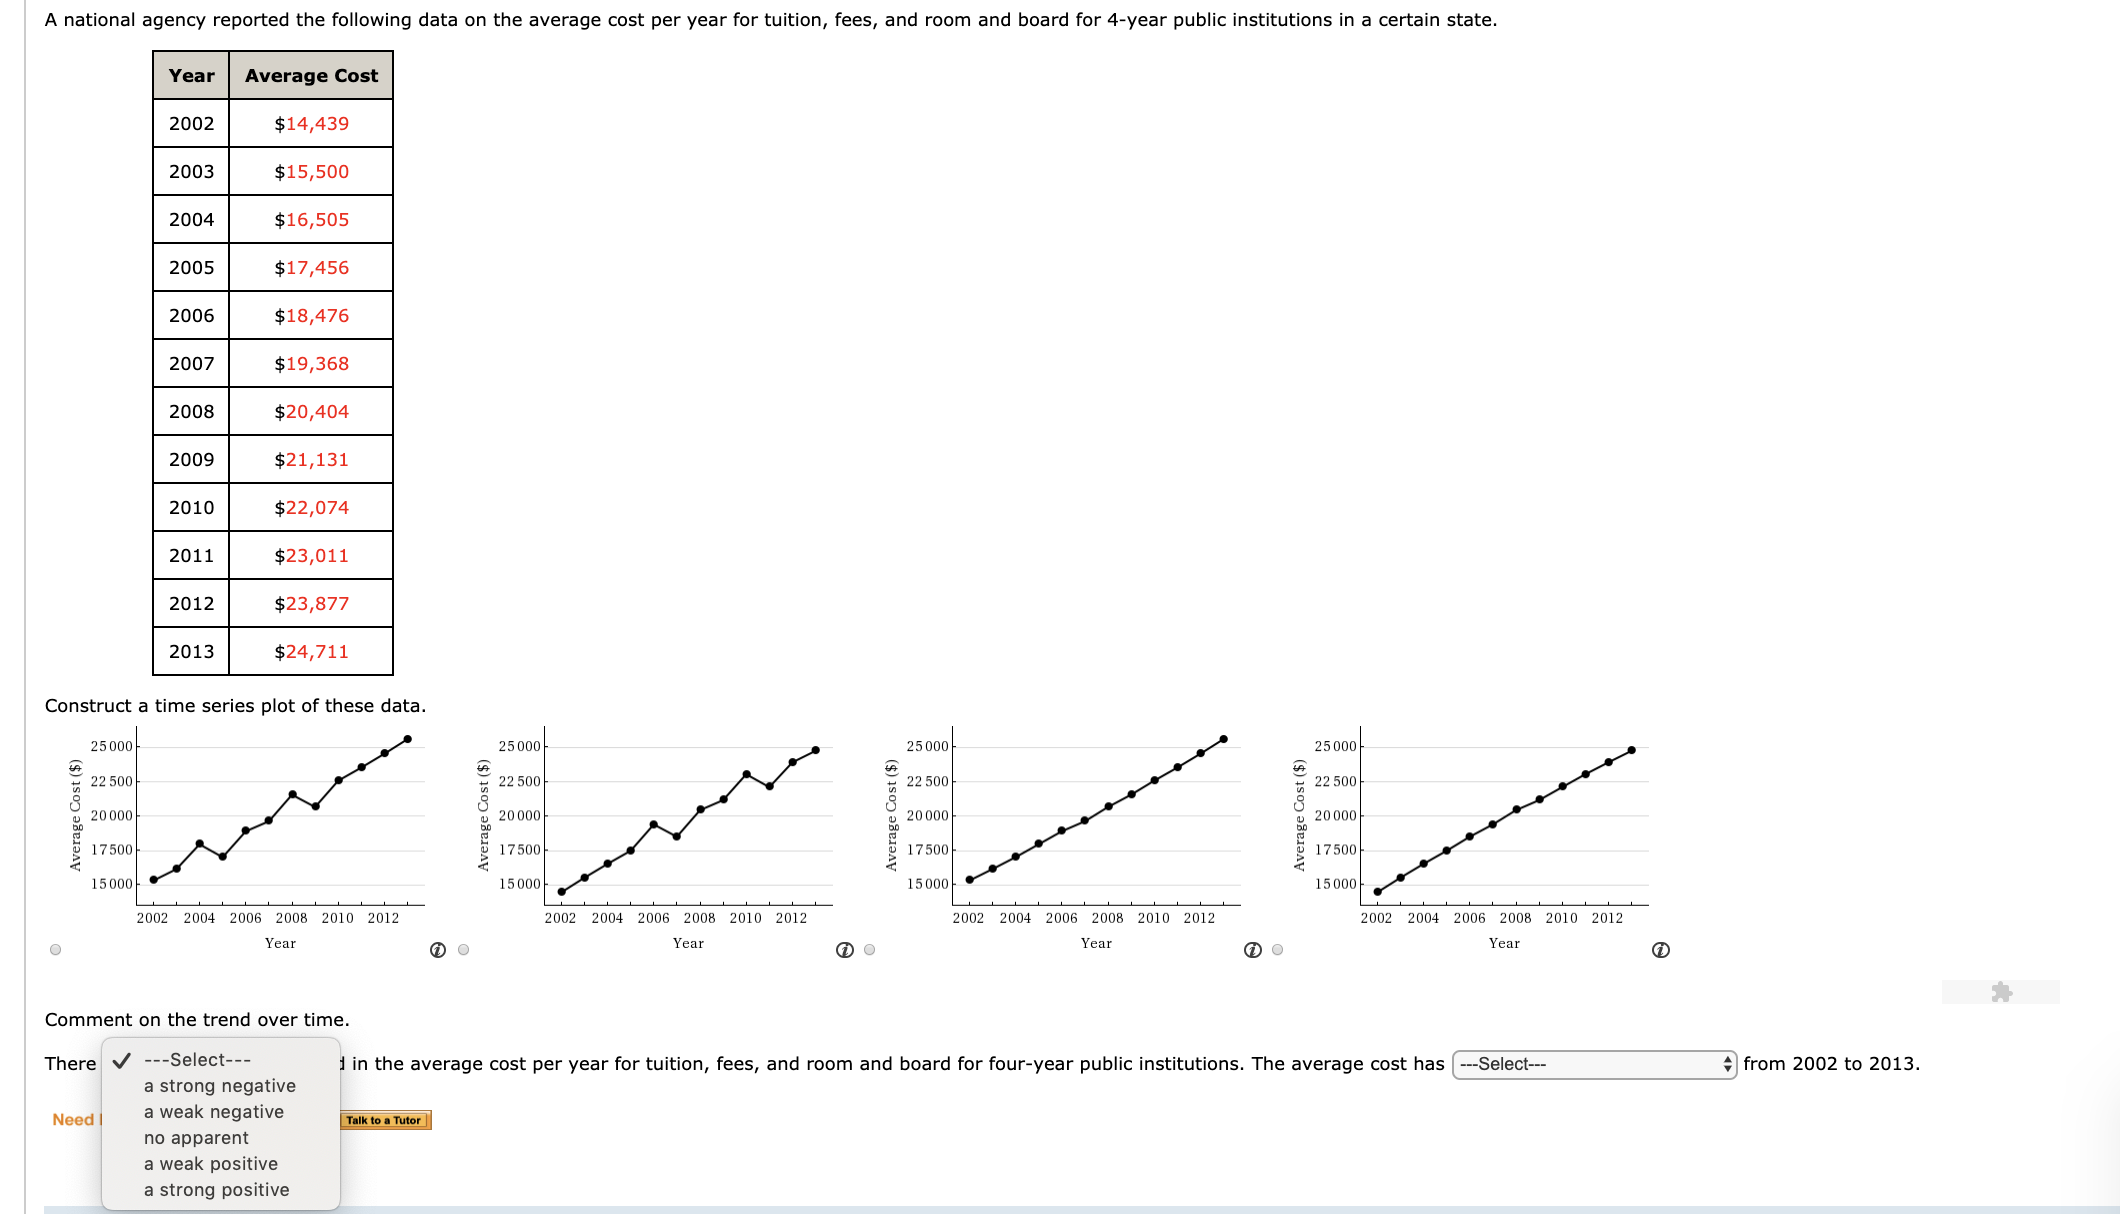
which graph is correct and trend comment? A national agency reported the following data on the average cost per year for tuition, fees, and room

which graph is correct and trend comment?

image text in transcribed
A national agency reported the following data on the average cost per year for tuition, fees, and room and board for 4-year public institutions in a certain state. Year Average Cost 2002 $14,439 200 $15,500 2004 $16,505 2005 $17,456 2006 $18,476 2007 $19,368 2008 $20,404 2009 $21,131 2010 $22,074 2011 $23,011 2012 $23,877 2013 $24,711 Construct a time series plot of these data. 25 000 25 000 25000 25 000 Average Cost ($ 22 500 22 500 20 000 age Cost 22 500 22 500 20 000 20 000 20 000 17500 Aver 17500 Average Cost 17500 17500 15000 Average Cost 15 000 15 000 15 000 2002 2004 2006 2008 2010 2012 2002 2004 2006 2008 2010 2012 2002 2004 2006 2008 2010 2012 2002 2004 2006 2008 2010 2012 Year Year Year Year Comment on the trend over time. There ---Select--- a strong negative in the average cost per year for tuition, fees, and room and board for four-year public institutions. The average cost has ---Select--- from 2002 to 2013. Need a weak negative no apparent Talk to a Tutor a weak positive a strong positive

Step by Step Solution

There are 3 Steps involved in it

Step: 1

blur-text-image

Get Instant Access to Expert-Tailored Solutions

See step-by-step solutions with expert insights and AI powered tools for academic success

Step: 2

blur-text-image

Step: 3

blur-text-image

Ace Your Homework with AI

Get the answers you need in no time with our AI-driven, step-by-step assistance

Get Started

Recommended Textbook for

An Introduction to Analysis

Authors: William R. Wade

4th edition

132296381, 978-0132296380

More Books

Students also viewed these Mathematics questions

Question

5. People grow as they move from external to internal commitment.

Answered: 1 week ago