Question
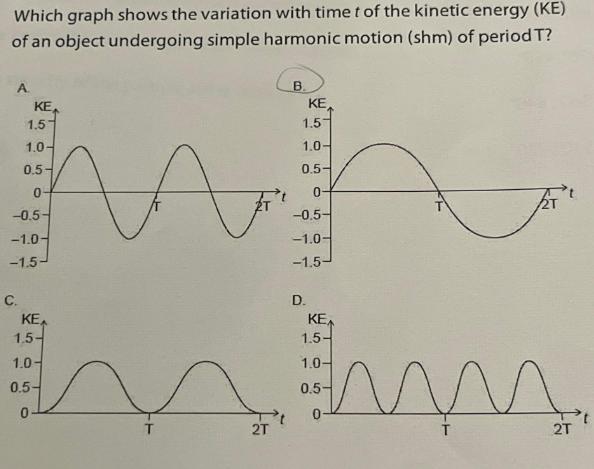
Which graph shows the variation with time t of the kinetic energy (KE) of an object undergoing simple harmonic motion (shm) of period T?

Which graph shows the variation with time t of the kinetic energy (KE) of an object undergoing simple harmonic motion (shm) of period T? A KE 1.5 1.0- 0.5- 0- -0.5- -1.0- -1.5- C. KE D. KE 1.5- mun 1.0- 0.5- 0- 2T 1.5- 1.0- 0.5- 0- B. T KE 1.5 1.0- 0.5- 0- -0.5- -1.0- -1.5- N 2T
Step by Step Solution
There are 3 Steps involved in it
Step: 1
The correct graph is C Heres why In simple harmonic motionthe kinetic energy KE and potential ene...
Get Instant Access to Expert-Tailored Solutions
See step-by-step solutions with expert insights and AI powered tools for academic success
Step: 2

Step: 3

Ace Your Homework with AI
Get the answers you need in no time with our AI-driven, step-by-step assistance
Get StartedRecommended Textbook for
Physics
Authors: James S. Walker
5th edition
978-0133498493, 9780321909107, 133498492, 0321909100, 978-0321976444
Students also viewed these Physics questions
Question
Answered: 1 week ago
Question
Answered: 1 week ago
Question
Answered: 1 week ago
Question
Answered: 1 week ago
Question
Answered: 1 week ago
Question
Answered: 1 week ago
Question
Answered: 1 week ago
Question
Answered: 1 week ago
Question
Answered: 1 week ago
Question
Answered: 1 week ago
Question
Answered: 1 week ago
Question
Answered: 1 week ago
Question
Answered: 1 week ago
Question
Answered: 1 week ago
Question
Answered: 1 week ago
Question
Answered: 1 week ago
Question
Answered: 1 week ago
Question
Answered: 1 week ago
Question
Answered: 1 week ago
Question
Answered: 1 week ago
Question
Answered: 1 week ago
View Answer in SolutionInn App


