

Answered step by step
Verified Expert Solution
Question
1 Approved Answer
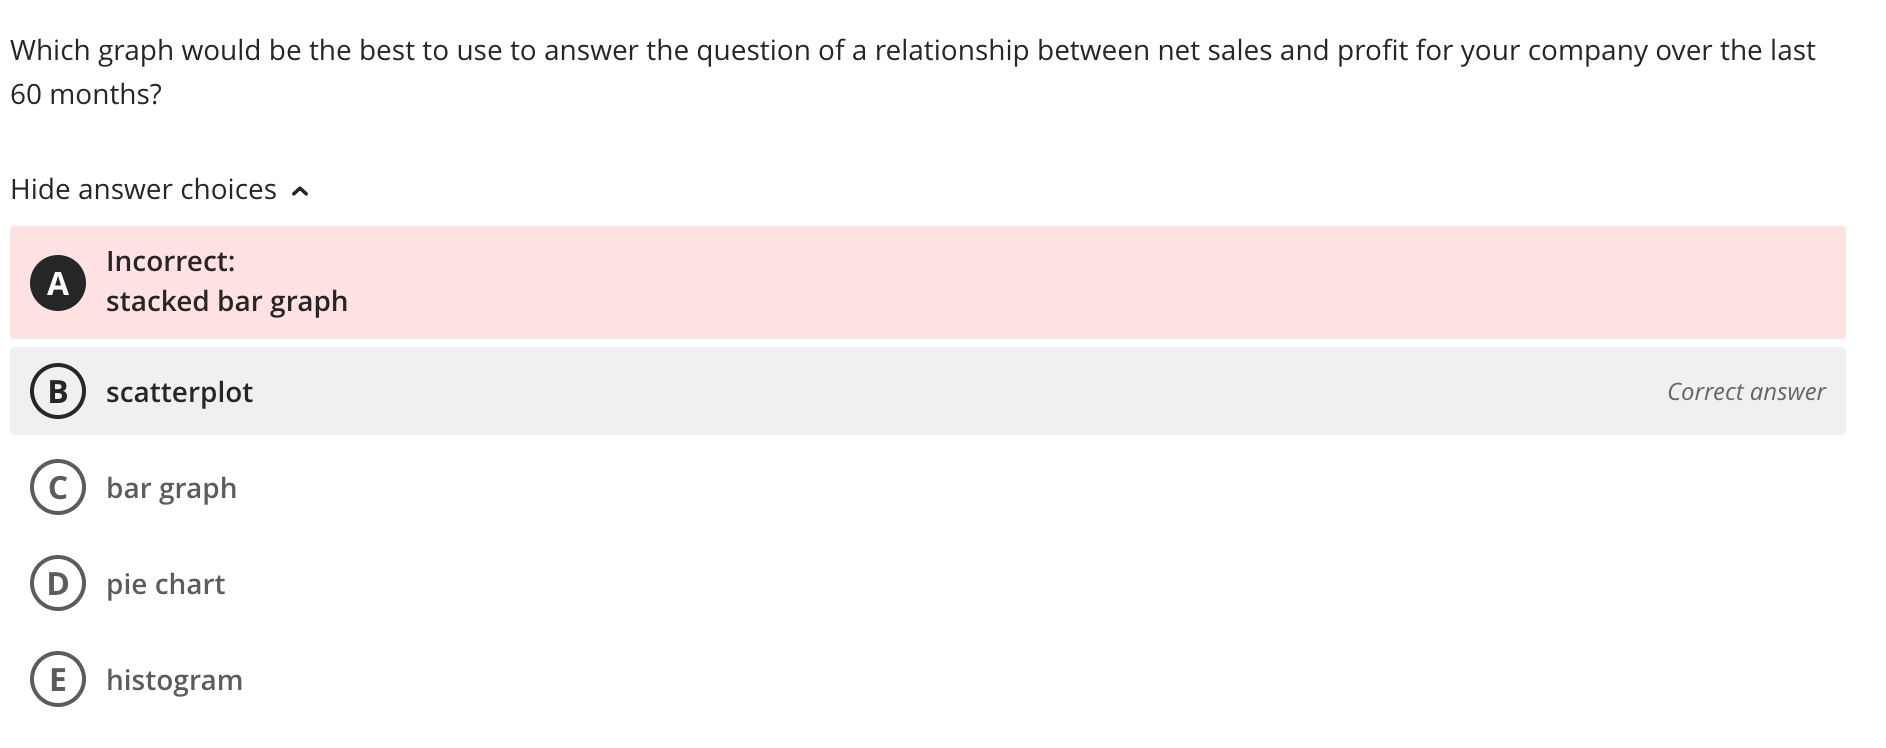
Which graph would be the best to use to answer the question ofa relationship between net sales and profit for your company over the last


Step by Step Solution
There are 3 Steps involved in it
Step: 1

Get Instant Access to Expert-Tailored Solutions
See step-by-step solutions with expert insights and AI powered tools for academic success
Step: 2

Step: 3
Ace Your Homework with AI
Get the answers you need in no time with our AI-driven, step-by-step assistance
Get Started
Calculus With Applications
Authors: Margaret L Lial, Raymond N Greenwell, Nathan P Ritchey
10th Edition
0321831101, 9780321831101