

Answered step by step
Verified Expert Solution
Question
1 Approved Answer
Which histogram depicts a higher standard deviation? 10- Frequency 8- 8642 4- 2- 0- 40 44 48 52 56 60 (a) Frequency 4- 10-
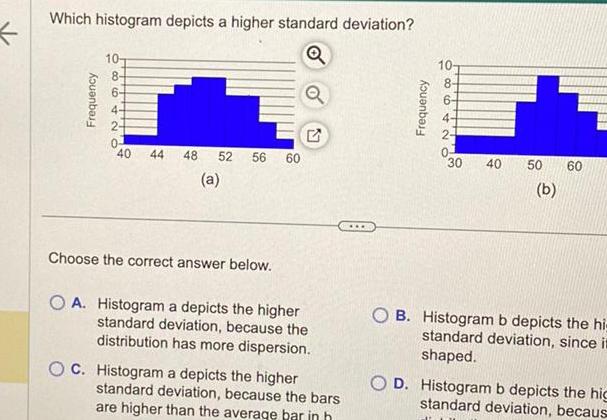
Which histogram depicts a higher standard deviation? 10- Frequency 8- 8642 4- 2- 0- 40 44 48 52 56 60 (a) Frequency 4- 10- 8- 30 40 50 60 (b) Choose the correct answer below. OA. Histogram a depicts the higher standard deviation, because the distribution has more dispersion. OC. Histogram a depicts the higher standard deviation, because the bars are higher than the average bar in h OB. Histogram b depicts the hi- standard deviation, since it shaped. D. Histogram b depicts the hig standard deviation, becaus
Step by Step Solution
There are 3 Steps involved in it
Step: 1

Get Instant Access to Expert-Tailored Solutions
See step-by-step solutions with expert insights and AI powered tools for academic success
Step: 2

Step: 3
Ace Your Homework with AI
Get the answers you need in no time with our AI-driven, step-by-step assistance
Get Started
General Chemistry
Authors: John McMurry, Robert Fay
2nd Edition
321809262, 978-0321809261