Question
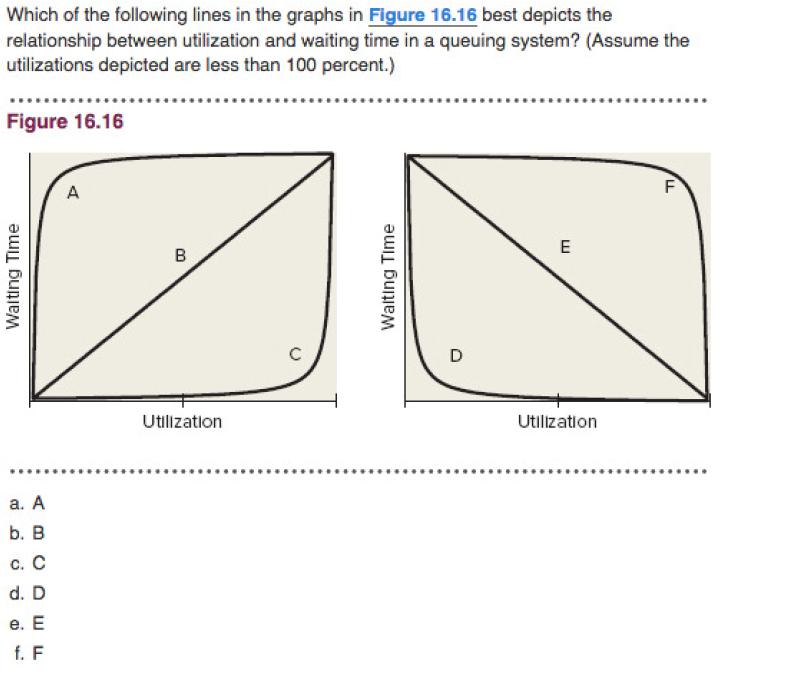
Which of the following lines in the graphs in Figure 16.16 best depicts the relationship between utilization and waiting time in a queuing system?

Which of the following lines in the graphs in Figure 16.16 best depicts the relationship between utilization and waiting time in a queuing system? (Assume the utilizations depicted are less than 100 percent.) Figure 16.16 F B D Utilization Utilization . b. B . d. D . f. F Walting Time Walting Time
Step by Step Solution
3.36 Rating (159 Votes )
There are 3 Steps involved in it
Step: 1
Answer c C Explanation In all queueing systems the higher the average utilizatio...
Get Instant Access to Expert-Tailored Solutions
See step-by-step solutions with expert insights and AI powered tools for academic success
Step: 2

Step: 3

Ace Your Homework with AI
Get the answers you need in no time with our AI-driven, step-by-step assistance
Get StartedRecommended Textbook for
Elementary Statisitcs
Authors: Barry Monk
2nd edition
1259345297, 978-0077836351, 77836359, 978-1259295911, 1259295915, 978-1259292484, 1259292487, 978-1259345296
Students also viewed these Accounting questions
Question
Answered: 1 week ago
Question
Answered: 1 week ago
Question
Answered: 1 week ago
Question
Answered: 1 week ago
Question
Answered: 1 week ago
Question
Answered: 1 week ago
Question
Answered: 1 week ago
Question
Answered: 1 week ago
Question
Answered: 1 week ago
Question
Answered: 1 week ago
Question
Answered: 1 week ago
Question
Answered: 1 week ago
Question
Answered: 1 week ago
Question
Answered: 1 week ago
Question
Answered: 1 week ago
Question
Answered: 1 week ago
Question
Answered: 1 week ago
Question
Answered: 1 week ago
Question
Answered: 1 week ago
Question
Answered: 1 week ago
View Answer in SolutionInn App


