Answered step by step
Verified Expert Solution
Question
1 Approved Answer
Which of the following statements is false? A visual scatter graph is more precise than regression analysis when drawing a line that best fits a

Which of the following statements is false? A visual scatter graph is more precise than regression analysis when drawing a line that best fits a data set. All of the statements are false. The R Square produced in regression analysis represents the estimated variable cost per unit. The high/low method is the most accurate method of estimating fixed and variable cost.
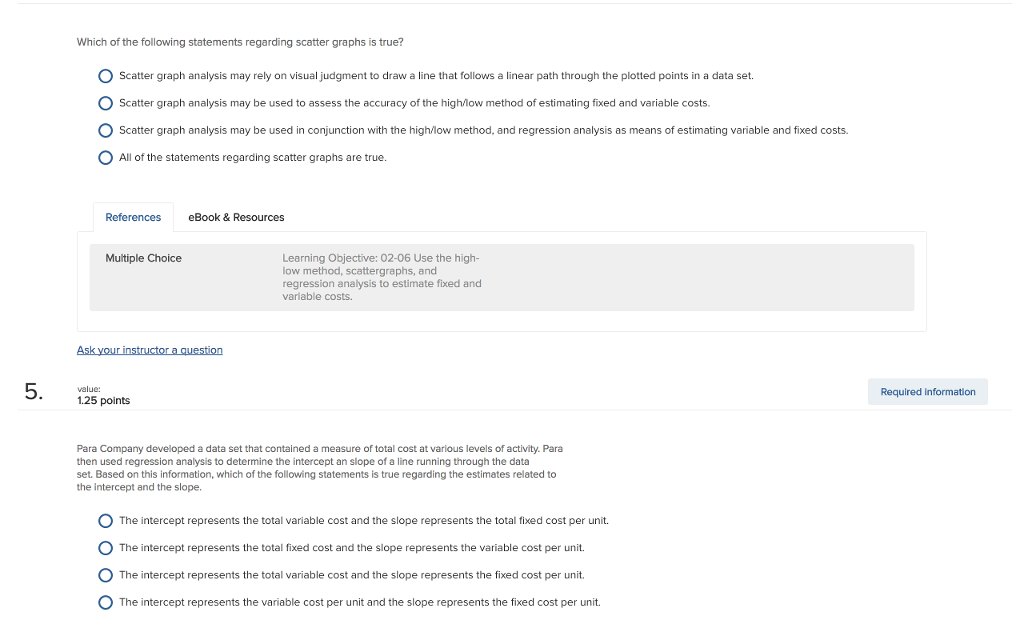
Which of the following statements regarding scatter graphs is true? O scatter graph analysis may rely on visual judgment to draw a line that follows a linear path through the plotted points in a data set. O scatter graph analysis may be used to assess the accuracy of the highMow method of estimating fixed and variable costs. O Scatter graph analysis may be used in conjunction with the highMow method, and regression analysis as means of estimating variable and fixed costs. O All of the statements regarding scatter graphs are true. References eBook & Resources Multiple Choice Learning Objective: 02-06 Use the high- low method, scattergraphs, and regression analysis to estimate fixed and variable costs. Ask your instructor a question 1.25 points Para Company developed a data set that contained a measure of total cost at various levels of activity. Para then used regression analysis to determine the intercept an slope of a line running through the data set. Based on this information, which of the following statements is true regarding the estimates related to the intercept and the slope. O The intercept represents the total variable cost and the slope represents the total fixed cost per unit. O The intercept represents the total fixed cost and the slope represents the variable cost per unit. O The intercept represents the total variable cost and the slope represents the fixed cost per unit. O The intercept represents the variable cost per unit and the slope represents the fixed cost per unit. Required information
Step by Step Solution
There are 3 Steps involved in it
Step: 1

Get Instant Access to Expert-Tailored Solutions
See step-by-step solutions with expert insights and AI powered tools for academic success
Step: 2

Step: 3

Ace Your Homework with AI
Get the answers you need in no time with our AI-driven, step-by-step assistance
Get Started


