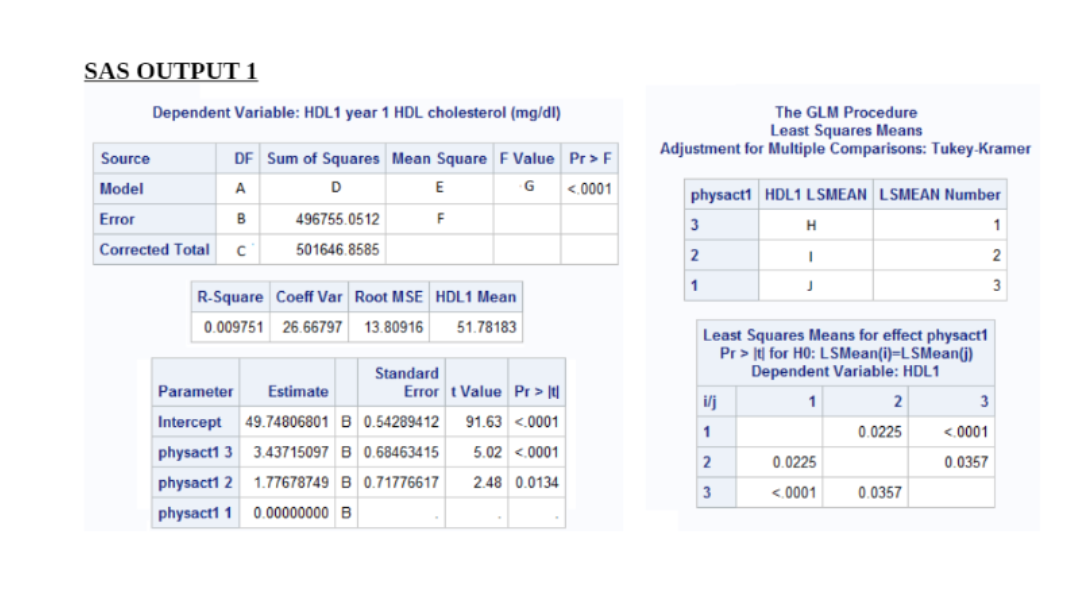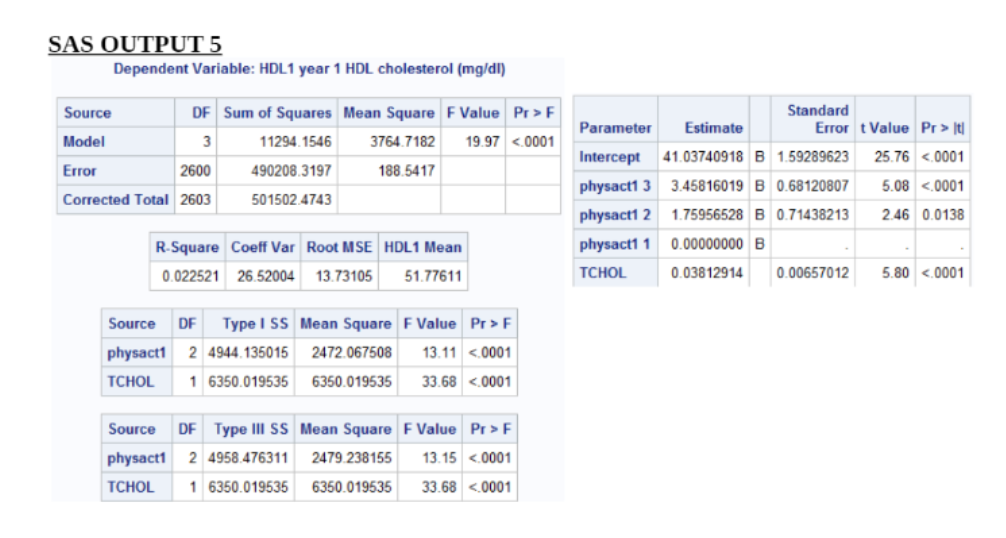
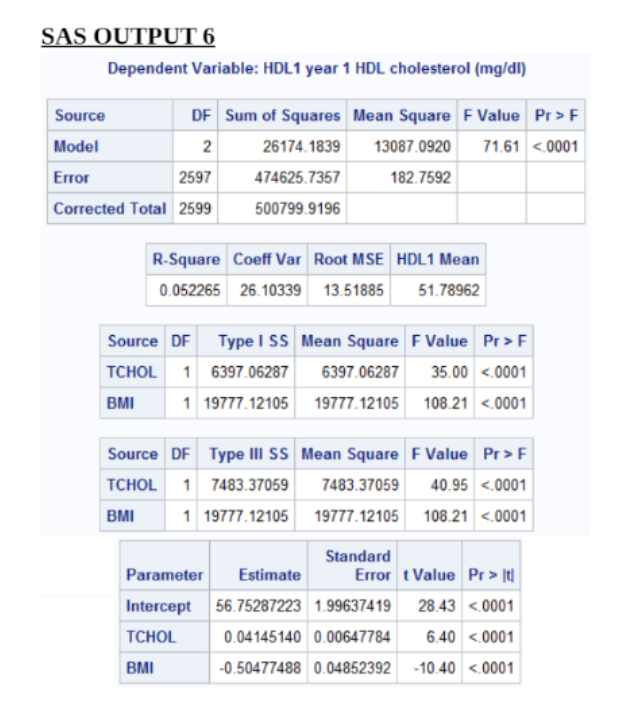
Which of the SAS outputs attached would assess the effects of physical activity and smoking status on HDL at year 1?
SAS OUTPUT 1 Dependent Variable: HDL1 year 1 HDL cholesterol (mg/dl) The GLM Procedure Least Squares Means Source DF Sum of Squares Mean Square F Value Pr > F Adjustment for Multiple Comparisons: Tukey-Kramer Model A D E G <.0001 physact1 hdl1 lsmean number error b f h corrected total c r-square coeff var root mse mean least squares means for effect pr> It) for HO: LSMean(i)=LSMean(j) Standard Dependent Variable: HDL1 Parameter Estimate Error t Value Pr > |t) i/j 2 3 Intercept 49.74806801 B 0.54289412 91.63 <.0001 physact1 b bsas output dependent variable: hdl1 year hdl cholesterol source df sum of squares mean square f value pr> F Standard Parameter Estimate Error t Value Pr > It Model 5 5568.5601 1113.7120 5.84 <.0001 intercept b error physact1 corrected total r-square coeff var root mse hdl1 mean smoking source df type i ss square f value pr> F physact1" SMOKING 3 1 0. 14499250 B 1.96398691 0.07 0.9412 physact1 2 4891.807273 2445.903636 12 83 <.0001 physact1 smoking b source df type iii ss mean square f value pr> F physact1" SMOKING 1 1 0.00000000 B physact1 2 2340.410047 1170.205024 6. 14 0.0022 physact1" SMOKING 1 0 0.00000000 B SMOKING 1 409.443473 409.443473 2.15 0.1429 physact1* SMOKING 2 246.430781 123.215391 0.65 0.5241SAS OUTPUT 3 Dependent Variable: HDL1 year 1 HDL cholesterol (mg/al) Source DF Sum of Squares Mean Square F Value Pr > F Standard Parameter Estimate Error t Value Pr > It) Model 3 5322.1293 1774.0431 9.31 <.0001 intercept b error physact1 corrected total r-square coeff var root mse hdl1 mean smoking source df type i ss square f value pr> F physact1 2 4891.807273 2445.903636 12.83 <.0001 smoking source df type iii ss mean square f value pr> F physact1 2 4593.901909 2296.950955 12.05 <.0001 smoking output dependent variable: hdl1 year hdl cholesterol source df sum of squares mean square f value pr> F Model 1449.4757 1449.4757 7.55 0.0060 Error 2606 500197 3828 191.9407 Corrected Total 2607 501646.8585 R-Square Coeff Var Root MSE HDL1 Mean 0.002889 26.75507 13.85427 51.78183 Source DF Type I SS Mean Square F Value Pr > F EXERCISE 1 1449.475715 1449.475715 7.55 0.0060 Source DF Type III SS Mean Square F Value Pr > F EXERCISE 1449.475715 1449.475715 7.55 0.0060 Standard Parameter Estimate Error t Value Pr > It Intercept 51.18193304 B 0.34821145 146.99 <.0001 exercise b bsas output dependent variable: hdl1 year hdl cholesterol source df sum of squares mean square f value pr> F Standard Parameter Estimate Error t Value Pr > It Model 3 11294.1546 3764.7182 19.97 <.0001 intercept b error physact1 corrected total r-square coeff var root mse hdl1 mean tchol source df type i ss square f value pr> F physact1 2 4944.135015 2472.067508 13.11 <.0001 tchol source df type iii ss mean square f value pr> F physact1 2 4958.476311 2479.238155 13.15 <.0001 tchol output dependent variable: hdl1 year hdl cholesterol source df sum of squares mean square f value pr> F Model 2 26174.1839 13087.0920 71.61 <.0001 error corrected total r-square coeff var root mse hdl1 mean source df type i ss square f value pr> F TCHOL 1 6397.06287 6397.06287 35.00 <.0001 bmi source df type iii ss mean square f value pr> F TCHOL 7483.37059 7483.37059 40.95 <.0001 bmi standard parameter estimate error t value pr> It Intercept 56.75287223 1.99637419 28.43 <.0001 tchol bmi>