Answered step by step
Verified Expert Solution
Question
1 Approved Answer
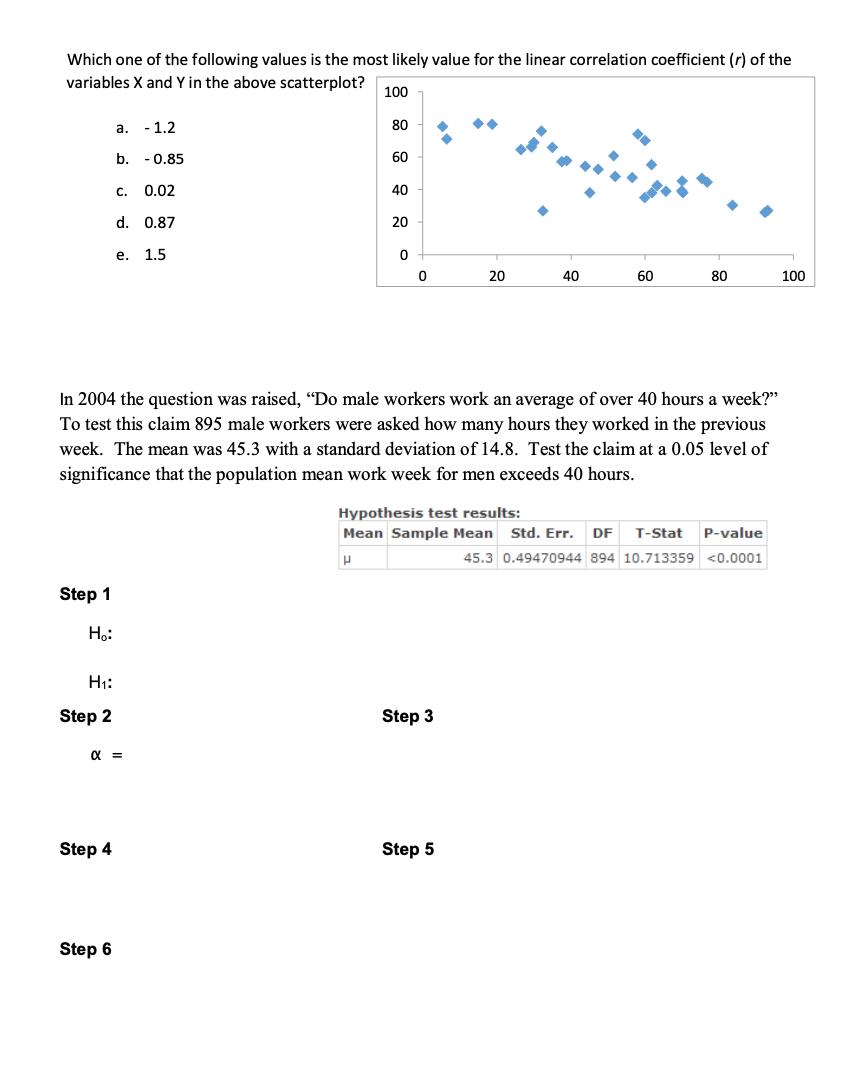
Which one of the following values is the most likely value for the linear correlation coefficient (r) of the variables X and Y in

Which one of the following values is the most likely value for the linear correlation coefficient (r) of the variables X and Y in the above scatterplot? Step 1 H: H: Step 2 a. - 1.2 b. Step 4 Step 6 C. 0.02 d. 0.87 e. 1.5 = 0.85 100 80 60 40 20 0 0 In 2004 the question was raised, "Do male workers work an average of over 40 hours a week?" To test this claim 895 male workers were asked how many hours they worked in the previous week. The mean was 45.3 with a standard deviation of 14.8. Test the claim at a 0.05 level of significance that the population mean work week for men exceeds 40 hours. 20 Step 3 40 Step 5 60 80 Hypothesis test results: Mean Sample Mean Std. Err. DF T-Stat P-value P 45.3 0.49470944 894 10.713359
Step by Step Solution
★★★★★
3.42 Rating (168 Votes )
There are 3 Steps involved in it
Step: 1
Answer From the given Scatter plot Y 085 Given that X 453 S 148 2 005 n ...
Get Instant Access to Expert-Tailored Solutions
See step-by-step solutions with expert insights and AI powered tools for academic success
Step: 2

Step: 3

Ace Your Homework with AI
Get the answers you need in no time with our AI-driven, step-by-step assistance
Get Started


