

Answered step by step
Verified Expert Solution
Question
1 Approved Answer
Which one of the graphs below represents a production function withboth increasing and decreasing returns to scale? 70. Which one of the graphs below could
Which one of the graphs below represents a production function withboth increasing and decreasing returns to scale?
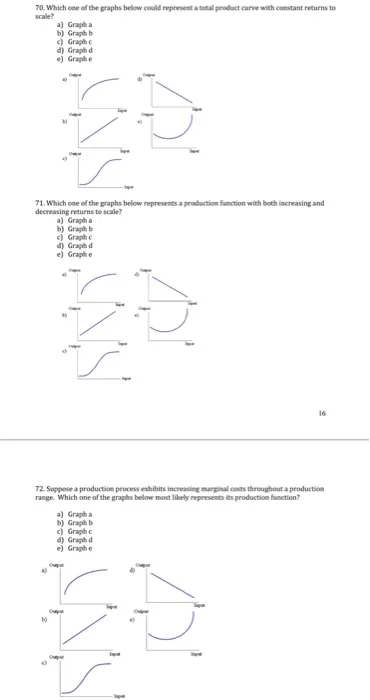
70. Which one of the graphs below could represent a total product curve with constant returns to scale? a) Graphia b) Graph b Graph c d) Graph d e) Graph e 1. Which one of the graphs below represents a production function with both increasing and decreasing returns to scale? a) Graph a b) Graph b Graph c d) Graph d e) Graph e range. Which one of the graphs below most likely repiresents its production function? a) Graph a b) Graphb c) Graph c d) Graphd e) Graph e
70. Which one of the graphs below could represent a total product curve with constant returns to scale? a) Graph a b) Graph b
Step by Step Solution
There are 3 Steps involved in it
Step: 1

Get Instant Access to Expert-Tailored Solutions
See step-by-step solutions with expert insights and AI powered tools for academic success
Step: 2

Step: 3
Ace Your Homework with AI
Get the answers you need in no time with our AI-driven, step-by-step assistance
Get Started
Managerial Economics A Problem-Solving Approach
Authors: Luke M. Froeb, Brain T. Mccann
2nd Edition
B00BTM8FK0