Answered step by step
Verified Expert Solution
Question
1 Approved Answer
While doing survey analyses for SIXER, a sports clothing company, the researcher is trying to understand the relationship between the variables youthful looking and


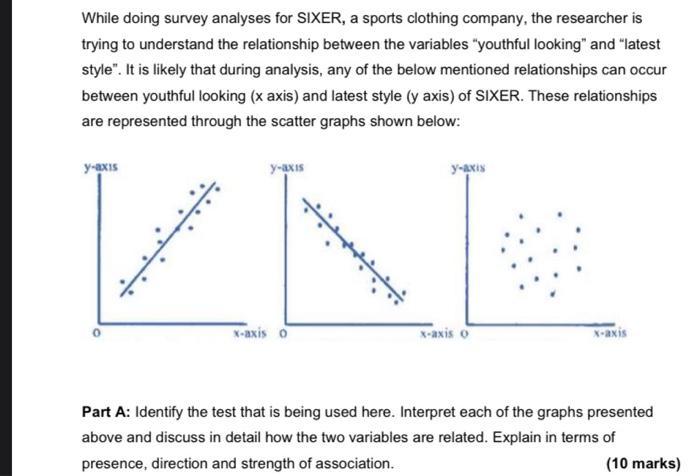
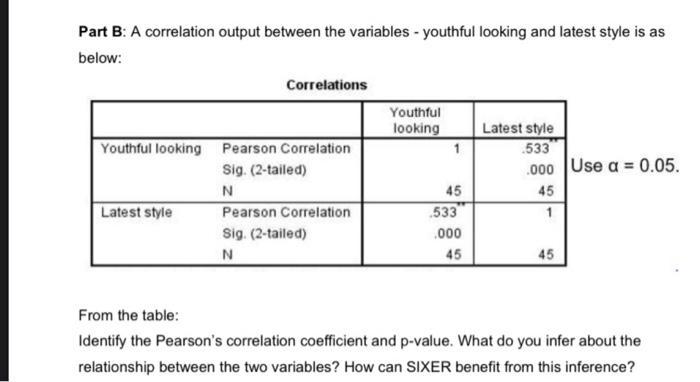
While doing survey analyses for SIXER, a sports clothing company, the researcher is trying to understand the relationship between the variables "youthful looking" and "latest style". It is likely that during analysis, any of the below mentioned relationships can occur between youthful looking (x axis) and latest style (y axis) of SIXER. These relationships are represented through the scatter graphs shown below: y-axis KN x-axis o y-axis y-axis x-axis o x-axis Part A: Identify the test that is being used here. Interpret each of the graphs presented above and discuss in detail how the two variables are related. Explain in terms of presence, direction and strength of association. (10 marks) Part B: A correlation output between the variables - youthful looking and latest style is as below: Correlations Youthful looking Pearson Correlation Sig. (2-tailed) N Latest style Pearson Correlation Sig. (2-tailed) N Youthful looking 1 45 533 .000 45 Latest style 533 .000 Use a = 0.05. 45 1 45 From the table: Identify the Pearson's correlation coefficient and p-value. What do you infer about the relationship between the two variables? How can SIXER benefit from this inference?
Step by Step Solution
★★★★★
3.43 Rating (159 Votes )
There are 3 Steps involved in it
Step: 1
A Using the plots the degree of association between the two variables has been tested The first plot ...
Get Instant Access to Expert-Tailored Solutions
See step-by-step solutions with expert insights and AI powered tools for academic success
Step: 2

Step: 3

Ace Your Homework with AI
Get the answers you need in no time with our AI-driven, step-by-step assistance
Get Started


