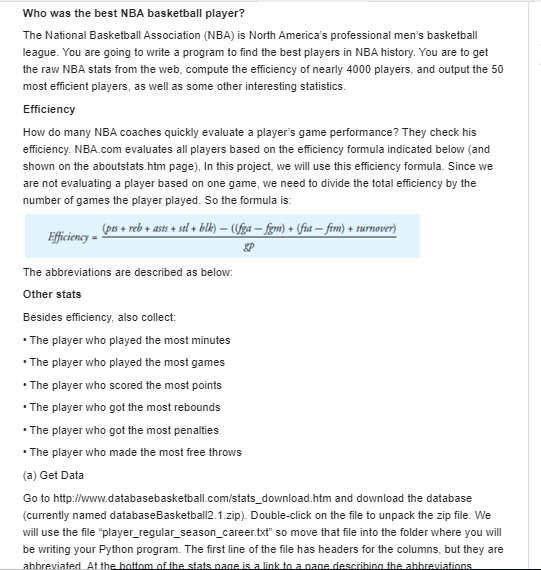
Who was the best NBA basketball player? The National Basketball Association (NBA) is North America's professional men's basketball league. You are going to write a program to find the best players in NBA history. You are to get the raw NBA stats from the web, compute the efficiency of nearly 4000 players, and output the 50 most efficient players, as well as some other interesting statistics. Efficiency How do many NBA coaches quickly evaluate a player's game performance? They check his efficiency. NBA.com evaluates all players based on the efficiency formula indicated below (and shown on the aboutstats.htm page), In this project, we will use this efficiency formula. Since we are not evaluating a player based on one game, we need to divide the total efficiency by the number of games the player played. So the formula is: (pes + reb++ sal + blk) - (Ofga-farm) + (fra - fam) + turnover) Efficiency - The abbreviations are described as below: Other stats Besides efficiency, also collect: The player who played the most minutes The player who played the most games The player who scored the most points The player who got the most rebounds The player who got the most penalties The player who made the most free throws (a) Get Data Go to http://www.databasebasketball.com/stats_download.htm and download the database (currently named databaseBasketball2.1.zip). Double-click on the file to unpack the zip file. We will use the file "player_regular_season_career. Dit so move that file into the folder where you will be writing your Python program. The first line of the file has headers for the columns, but they are abbreviated at the bottom of the stats name is a link to a nane describing the abbreviations Go to http://www.databasebasketball.comistats_download.htm and download the database (currently named databaseBasketball2.1.zip). Double-click on the file to unpack the zip file. We will use the file "player_regular_season_career.txt" so move that file into the folder where you will be writing your Python program. The first line of the file has headers for the columns, but they are abbreviated. At the bottom of the stats page is a link to a page describing the abbreviations (www.databasebasketball.com/about/aboutstats.htm. (b) Read Data To read the data we can use the get_data_list() function from the previous problem, but we need to make one important modification. Since the basketball data file separates the fields using vertical bars (?), we must replace the comma in the split function with a vertical bar: split (1) The function will return a list of lists that has one list for each player. (c) Process Data Calculate the statistics mentioned above, and then output them. For the efficiency, find the top 50 and then order them from best to worst. For calculating the other statistics, you could write one function for each, but you should notice a pattern after writing one or two that will indicate how to write one function that you can call for each statistic. (d) Output Format your output to make it readable and good-looking. Remember to print the top 50 in efficiency in order from best to worst. Printing should be a function. Who was the best NBA basketball player? The National Basketball Association (NBA) is North America's professional men's basketball league. You are going to write a program to find the best players in NBA history. You are to get the raw NBA stats from the web, compute the efficiency of nearly 4000 players, and output the 50 most efficient players, as well as some other interesting statistics. Efficiency How do many NBA coaches quickly evaluate a player's game performance? They check his efficiency. NBA.com evaluates all players based on the efficiency formula indicated below (and shown on the aboutstats.htm page), In this project, we will use this efficiency formula. Since we are not evaluating a player based on one game, we need to divide the total efficiency by the number of games the player played. So the formula is: (pes + reb++ sal + blk) - (Ofga-farm) + (fra - fam) + turnover) Efficiency - The abbreviations are described as below: Other stats Besides efficiency, also collect: The player who played the most minutes The player who played the most games The player who scored the most points The player who got the most rebounds The player who got the most penalties The player who made the most free throws (a) Get Data Go to http://www.databasebasketball.com/stats_download.htm and download the database (currently named databaseBasketball2.1.zip). Double-click on the file to unpack the zip file. We will use the file "player_regular_season_career. Dit so move that file into the folder where you will be writing your Python program. The first line of the file has headers for the columns, but they are abbreviated at the bottom of the stats name is a link to a nane describing the abbreviations Go to http://www.databasebasketball.comistats_download.htm and download the database (currently named databaseBasketball2.1.zip). Double-click on the file to unpack the zip file. We will use the file "player_regular_season_career.txt" so move that file into the folder where you will be writing your Python program. The first line of the file has headers for the columns, but they are abbreviated. At the bottom of the stats page is a link to a page describing the abbreviations (www.databasebasketball.com/about/aboutstats.htm. (b) Read Data To read the data we can use the get_data_list() function from the previous problem, but we need to make one important modification. Since the basketball data file separates the fields using vertical bars (?), we must replace the comma in the split function with a vertical bar: split (1) The function will return a list of lists that has one list for each player. (c) Process Data Calculate the statistics mentioned above, and then output them. For the efficiency, find the top 50 and then order them from best to worst. For calculating the other statistics, you could write one function for each, but you should notice a pattern after writing one or two that will indicate how to write one function that you can call for each statistic. (d) Output Format your output to make it readable and good-looking. Remember to print the top 50 in efficiency in order from best to worst. Printing should be a function