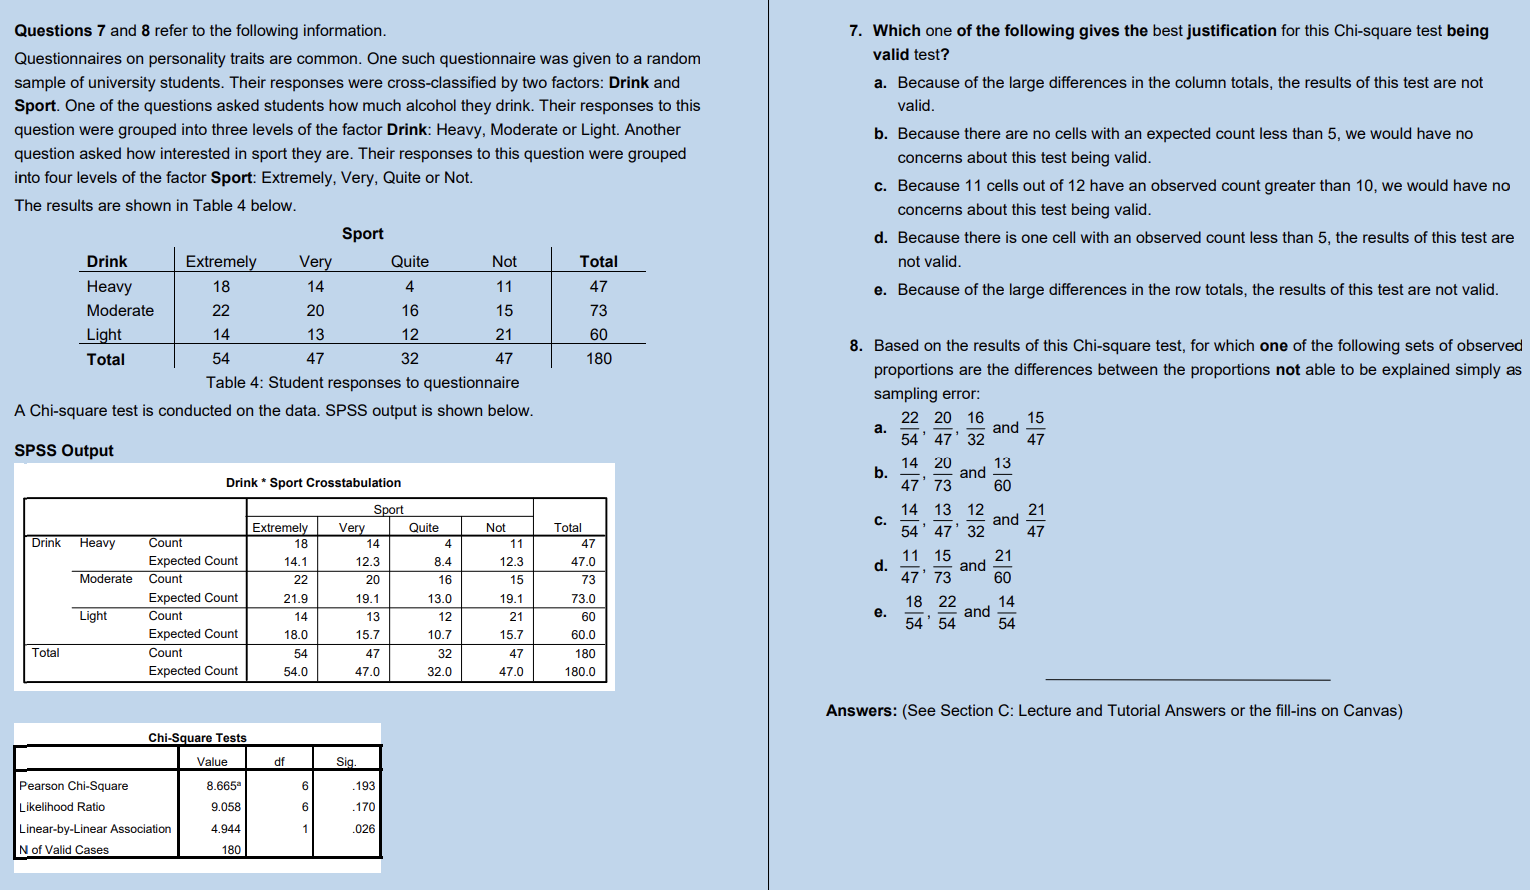
Why is the answer for question 8 = (e)?
Questions 7 and 8 refer to the following information. 7. Which one of the following gives the best justification for this Chi-square test being Questionnaires on personality traits are common. One such questionnaire was given to a random valid test? sample of university students. Their responses were cross-classified by two factors: Drink and a. Because of the large differences in the column totals, the results of this test are not Sport. One of the questions asked students how much alcohol they drink. Their responses to this valid. question were grouped into three levels of the factor Drink: Heavy, Moderate or Light. Another b. Because there are no cells with an expected count less than 5, we would have no question asked how interested in sport they are. Their responses to this question were grouped concerns about this test being valid. into four levels of the factor Sport: Extremely, Very, Quite or Not. c. Because 11 cells out of 12 have an observed count greater than 10, we would have no The results are shown in Table 4 below. concerns about this test being valid. Sport d. Because there is one cell with an observed count less than 5, the results of this test are Drink Extremely Very Quite Not Total not valid. Heavy 18 14 4 11 47 e. Because of the large differences in the row totals, the results of this test are not valid. Moderate 22 20 16 15 73 Light 14 13 12 21 60 Total 54 8. Based on the results of this Chi-square test, for which one of the following sets of observed 17 32 47 180 proportions are the differences between the proportions not able to be explained simply as Table 4: Student responses to questionnaire sampling error: A Chi-square test is conducted on the data. SPSS output is shown below. 22 20 16 a. 54' 47' 32 and 15 47 SPSS Output 14 20 and 13 Drink * Sport Crosstabulation D. 47' 73 60 Sport Extremely Very Quite Not Total C. 14 13 12 54' 47' 32 and 21 47 Drink Heavy Count 18 14 11 47 Expected Count 14.1 12.3 8.4 12.3 47.0 d. 11 15 Moderate Count 22 20 16 15 73 47' 73 and 21 60 Expected Count 21.9 19.1 13.0 19.1 73.0 18 22 Light Count 14 13 14 12 21 60 e. 54' 54 and - 54 Expected Count 18.0 15.7 10.7 15.7 60.0 Total Count 54 32 47 180 Expected Count 54.0 47.0 32.0 47.0 180.0 Answers: (See Section C: Lecture and Tutorial Answers or the fill-ins on Canvas) Chi-Square Tests Value df Sig Pearson Chi-Square 8.665 193 Likelihood Ratio 9.058 170 Linear-by-Linear Association 4.944 .026 N of Valid Cases 180


