

Question: Why was it important to draw the tree diagram so that all outcomes were equally likely? A tree diagram shows an equal out display
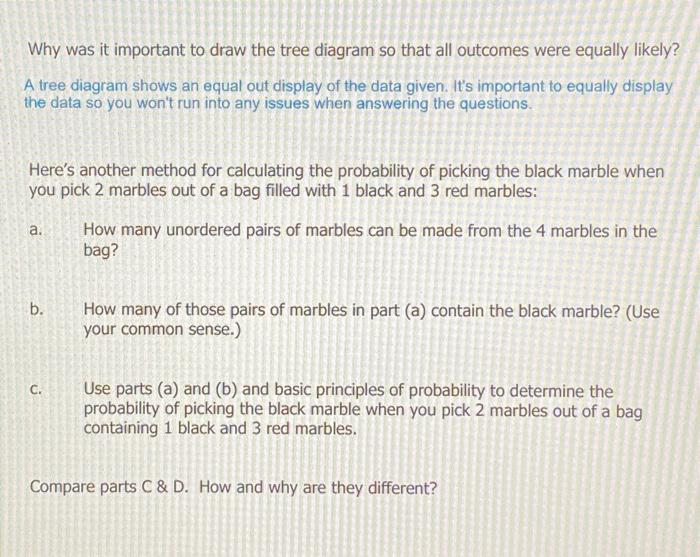
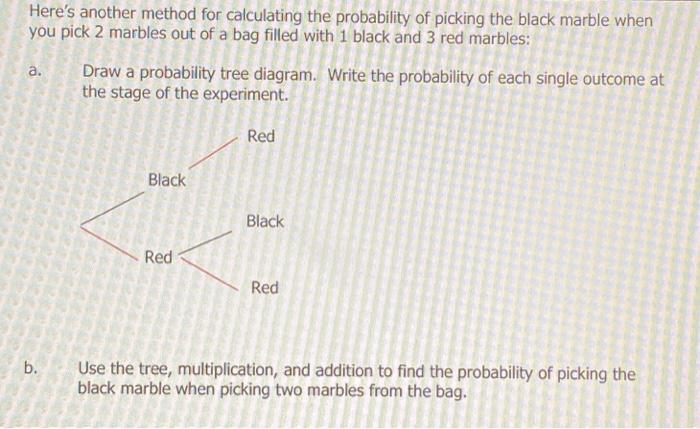
Why was it important to draw the tree diagram so that all outcomes were equally likely? A tree diagram shows an equal out display of the data given. It's important to equally display the data so you won't run into any issues when answering the questions. Here's another method for calculating the probability of picking the black marble when you pick 2 marbles out of a bag filled with 1 black and 3 red marbles: a. b. C. How many unordered pairs of marbles can be made from the 4 marbles in the bag? How many of those pairs of marbles in part (a) contain the black marble? (Use your common sense.) Use parts (a) and (b) and basic principles of probability to determine the probability of picking the black marble when you pick 2 marbles out of a bag containing 1 black and 3 red marbles. Compare parts C & D. How and why are they different? Here's another method for calculating the probability of picking the black marble when you pick 2 marbles out of a bag filled with 1 black and 3 red marbles: a. b. Draw a probability tree diagram. Write the probability of each single outcome at the stage of the experiment. Red Black Red Black Red Use the tree, multiplication, and addition to find the probability of picking the black marble when picking two marbles from the bag. A
Step by Step Solution
3.50 Rating (160 Votes )
There are 3 Steps involved in it
The prompt asks why it is important to draw a tree diagram so that all outcomes are equally likely T... View full answer

Get step-by-step solutions from verified subject matter experts