Wilkerson Companys profit has been declining, especially for the pump line, as they continue to reduce pump line prices to stay competitive in the market.
Wilkerson Company’s profit has been declining, especially for the pump line, as they continue to reduce pump line prices to stay competitive in the market. Yet, none of their competitors have tried to match Wilkerson’s price for flow controllers. Robert Parker, president of Wilkerson Company, is considering whether the problem is the costing system, and is thus pondering whether to change their cost accounting system to an activity-based system. He believes it may help with pricing decisions for the three product lines: pumps, valves, and flow controllers. You have been hired by Robert Parker to help evaluate Wilkerson Company’s costing system. Specifically, Robert wants your assessment of whether he should change its existing cost accounting system to an activity-based costing system. In addition, Robert also wants your assessment of what actions he can take to improve the company’s profitability along with explanations for your recommendations.
- Calculate (i) product cost per unit and (ii) profit margin per unit for Wilkerson’s three product lines using Activity-Based Costing with activity rates calculated based on capacity level as total activity driver.
- Calculate the cost of unused capacity cost at Wilkerson.


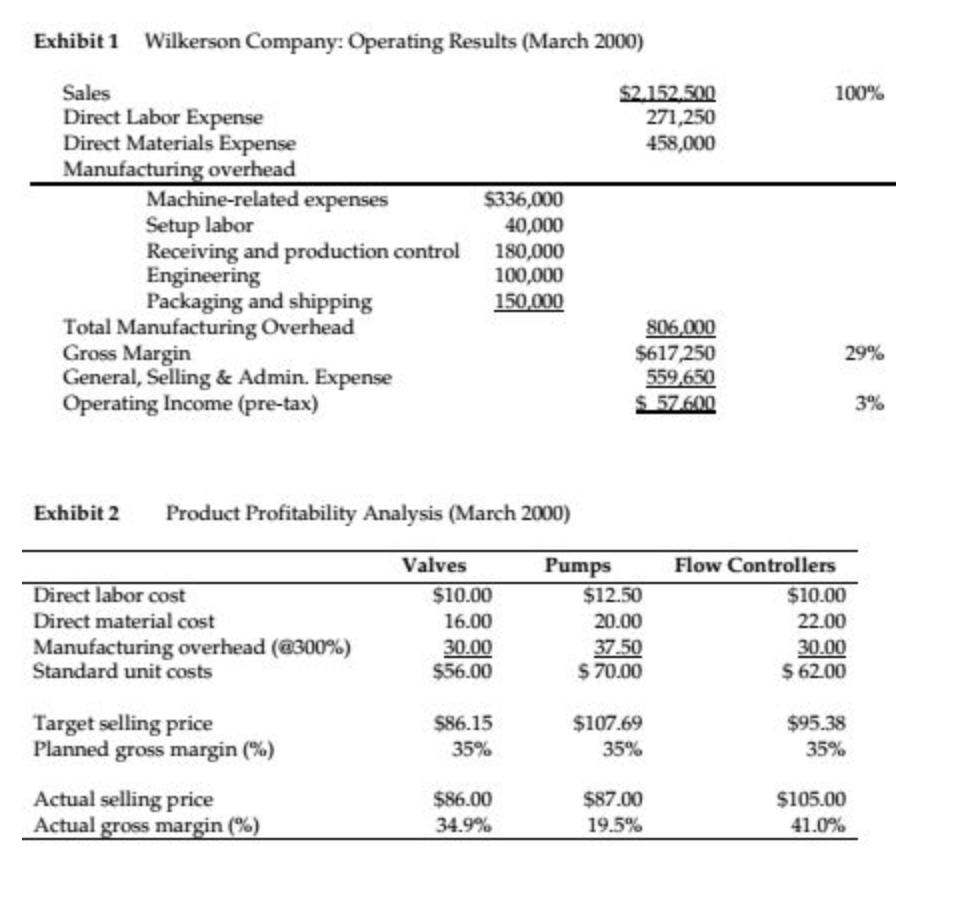
Exhibit 1 Wilkerson Company: Operating Results (March 2000) Sales Direct Labor Expense Direct Materials Expense Manufacturing overhead Machine-related expenses Setup labor Receiving and production control Engineering Packaging and shipping Total Manufacturing Overhead Gross Margin General, Selling & Admin. Expense Operating Income (pre-tax) Exhibit 2 Product Profitability Analysis (March 2000) Direct labor cost Direct material cost Manufacturing overhead (@300%) Standard unit costs Target selling price Planned gross margin (%) Actual selling price Actual gross margin (%) $336,000 40,000 180,000 100,000 150,000 Valves $10.00 16.00 30.00 $56.00 $86.15 35% $86.00 34.9% Pumps $2.152.500 271,250 458,000 806,000 $617,250 559,650 $57.600 $12.50 20.00 37.50 $70.00 $107.69 35% $87.00 19.5% 100% 29% Flow Controllers $10.00 22.00 30.00 $ 62.00 $95.38 35% $105.00 41.0% 3%
Step by Step Solution
3.40 Rating (150 Votes )
There are 3 Steps involved in it
Step: 1
Answer Calculate the profit of Future comes One way to determine the impact youll be able to wear yo...
See step-by-step solutions with expert insights and AI powered tools for academic success
Step: 2

Step: 3

Ace Your Homework with AI
Get the answers you need in no time with our AI-driven, step-by-step assistance
Get Started


