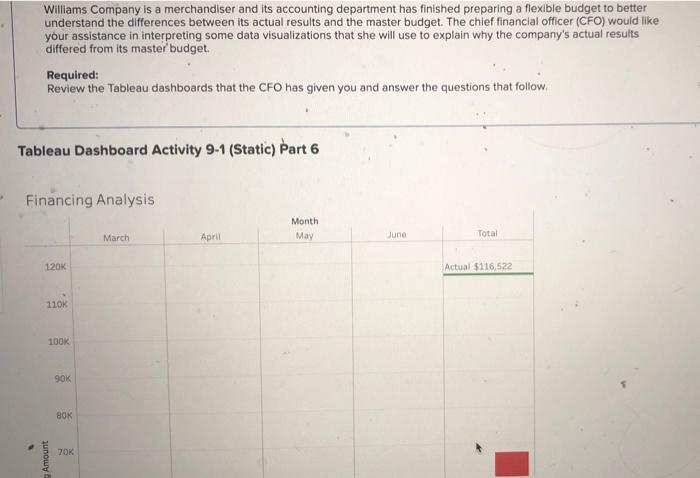
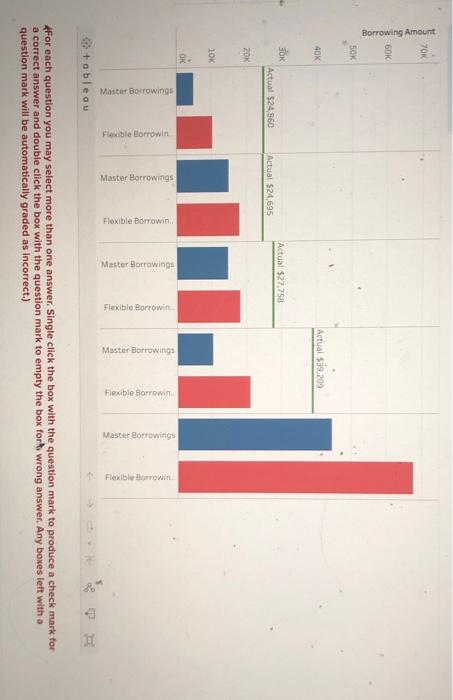
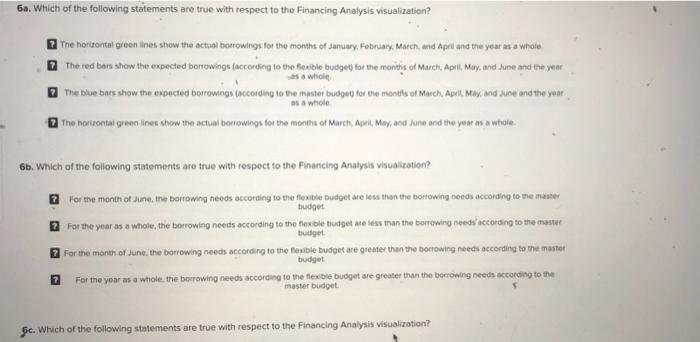
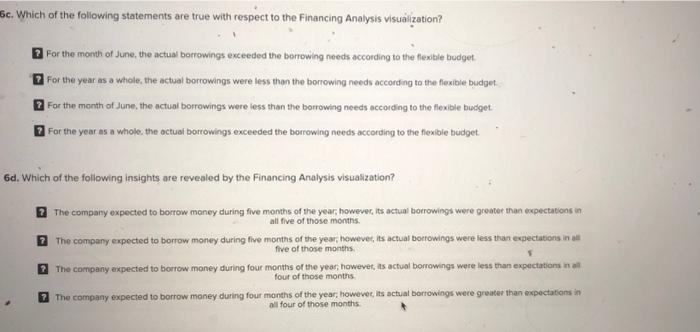
Williams Company is a merchandiser and its accounting department has finished preparing a flexible budget to better understand the differences between its actual results and the master budget. The chief financial officer (CFO) would like your assistance in interpreting some data visualizations that she will use to explain why the company's actual results differed from its master budget. Required: Review the Tableau dashboards that the CFO has given you and answer the questions that follow. Tableau Dashboard Activity 9-1 (Static) Part 6 Financing Analysis WFor each question you may select more than one answer. Single click the box with the question mark to produce a check mark for a correct answer and double click the box with the question mark to empty the box forti wrong answer. Any boxes left with a question mark will be automatically graded as incorrect.) 6a. Which of the following statements are true with respect to the Financing Analysis visualization? The horizontai green ines show the actual bocrowings for the months of January, February, March, and Apell and the year as a whole The red bars show the expected borrowings faccorbing to the fexible budget for the months of March, April, Miy, and fune and the year is a whole The blue bars show the expected borrowings (according to the master budget) for the mosfls of March. Apeil. May. and June and the year as a whole. 7 The horurontal green lines show the actual bockowings for the months of March, Apeil, May, and June and the yoar as a whole. 6b. Which of the following statements are true with respect to the Financing Analysis visualization? For the month of dane, the borrowing needs according to the floxible budget are iess then the boriowing needs acconding to the masker budget. For the year as a whole, the borrowing noeds according to the fexble tivdget are less than the barrowing seeds'iccorsing to the thaster buiget. For the manth of June, the borrowing needs according to the Fexible budget are greater than the bociowing needs according to the mastet budget For the year as a whole the bocrowing needs according to the flexble bubget se greater than the berrowing needs sccording to the master budget. 6.c. Which of the following statements are true with respect to the Financing Analysis visualization? 6c. Which of the following statements are true with respect to the Financing Analysis visualization? For the month of June, the actual borrowings exceeded the bonowing needs according to the flexible budget For the year as a whole, the actual borrowings were less than the borrowing needs according to the flexible budget: For the month of June, the actual borrowings were less than the borrowing needs according to the flexible budget. For the year as a whole the octuai borrowings exceeded the borrowing needs according to the fiexlbie budget. 6d. Which of the following insights are revealed by the Financing Analysis visualization? The company expected to borrow maney during five months of the year, howevec, its actual borrowings were greater than expectatons in all five of those months The company expected to borrow money during flive months of the year, howeve, its actual bortowings were less than expectations in all five of those months


